|
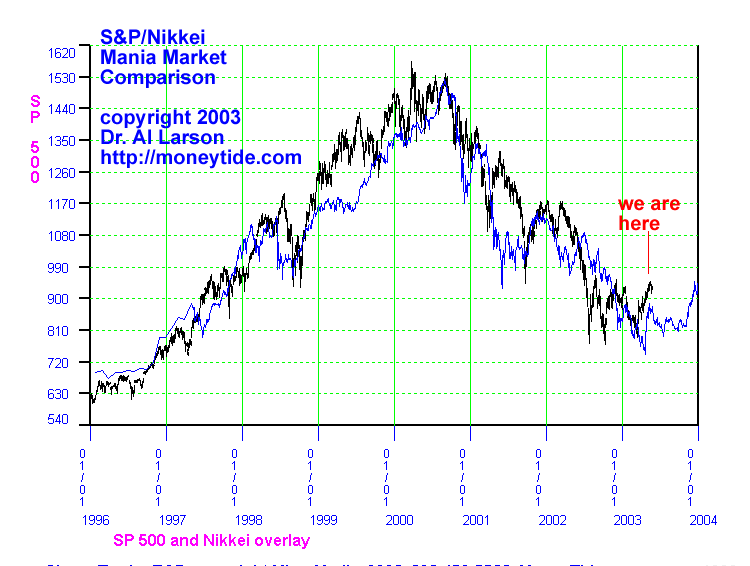
July 26, 2001 This chart shows two Mania Markets, the US stock market peaking in 2000, and the Japanese stock market peaking in late 1989. Both of these were fueled by a "Get Rich Quick" Mania. These are exactly similar to past manias, like the Tulip Mania, the South Sea Bubble, and the Crusades. It is possible to determine the underlying natural cycles that create these manias. I have done that, and can assure you that we ARE on the backside of a bubble. We DID tell our clients in 2000, that if a particular DEATHLINE 2000 was broken, to SELL, SELL, SELL. That is recorded in the writeup we did on THE GANN DEATH LINE 2000. We followed our own advise and sold all stocks October 6th, 2000. This chart may be posted on other websites, provided a link is made to Moneytide.com, or emailed to friends or clients, as long as it is unmodified. August 17, 2001 Update 
This chart shows the pressure the US stock market is currently under. It is following the general form of the decline in the Japanese market, but has not declined as much recently. Instead, it has paused and is now testing the 1170 level, which is close to a normal Fibonacci .382 retracement. But Mania Markets ARE NOT NORMAL. The Japanese market retraced more than .618 of it's final rally. I suspect the US market will as well. The support at 1170 is line A. Line B is the down resistance line. Interestingly, it is going down 33 per cent faster that the bull market went up. That is normal. Fear outruns greed. These two lines are pinching the market into a narrow trading range. One of the lines WILL BE BROKEN. If it is the 1170, then a sharp drop is probable, as prices drop to catch up to the Nikkei curve. A price of 1080 or 990 is probable. September 19, 2001 Update  This chart shows how prices today hit the 990 price level, as
anticipated. The spike nature of today's low suggests a
"patriot's rally" may be underway.
This chart shows how prices today hit the 990 price level, as
anticipated. The spike nature of today's low suggests a
"patriot's rally" may be underway.
Note that this chart analog anticipated the decline being blamed on the terrible act of violence upon the World Trade Center. Such is the nature of cycles. Many people have said they would not be sellers, since that made them feel unpatriotic. I disagree, having lived a year of terror in Vietnam. Don't change any behavior because of the terrorist attack- or they have won. For now, that looks like a moot point, since the Nikkei analog suggests a rally back above the 1080 level, with 1125 being probable. November 20, 2001 Update  The S&P has now rallied to the point shown on the chart above. The
Japanese market analog says that the patriot's rally is nearly over.
While prices may hold up into next year, 2002 looks like a down year.
The S&P has now rallied to the point shown on the chart above. The
Japanese market analog says that the patriot's rally is nearly over.
While prices may hold up into next year, 2002 looks like a down year.
January 16, 2002 Update  The S&P did hold up into the end of the year, just as the Nikkei analog
forecast. Now it looks like the next move is a steady decline to 990 or
just below.
The S&P did hold up into the end of the year, just as the Nikkei analog
forecast. Now it looks like the next move is a steady decline to 990 or
just below.
June 6, 2002 Update  The S&P has held above the Nikkie analog for several months, but has now
resumed tracking it. This says that we are likely to see 990 on the S&P,
and later 810. There is a popular view that says the US economy will be good
in the second half of the year. This analog says that belief will go unfulfilled.
The S&P has held above the Nikkie analog for several months, but has now
resumed tracking it. This says that we are likely to see 990 on the S&P,
and later 810. There is a popular view that says the US economy will be good
in the second half of the year. This analog says that belief will go unfulfilled.
November 8, 2002 Update 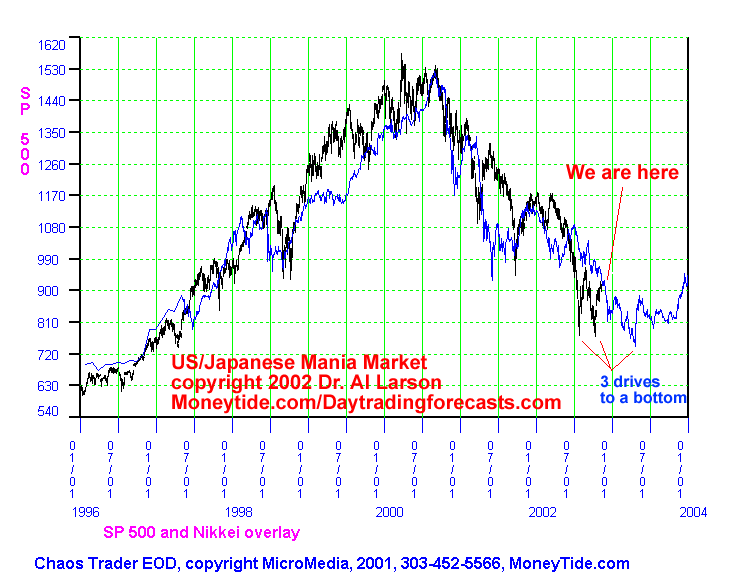 The market did drop to and even below the 810 target discussed in June. Since
then it has rallied to 927, and is now sitting at 900. Many are claiming
the bottom is in. This analog says it is not-not until next spring. Then there
will be no return of the great bull market. Instead, we can expect
several years of narrow range sideways markets.
The market did drop to and even below the 810 target discussed in June. Since
then it has rallied to 927, and is now sitting at 900. Many are claiming
the bottom is in. This analog says it is not-not until next spring. Then there
will be no return of the great bull market. Instead, we can expect
several years of narrow range sideways markets.
May 24, 2003 Update Other priorities prevented me from getting an update done as the market made its new lows this spring AS FORECAST. The decline to 790 was just 20 points under the 810 forecast level. We have now rallied in a fast move, just as the analog forecasts. The ratio of bulls to bears is at historic levels. The analog says that will change soon, with relief not in sight until late in the year.
Mania markets are a long term crowd psychology phenomena. They repeat because crowds act the same, over and over. History does repeat.
|