
May 17, 2001
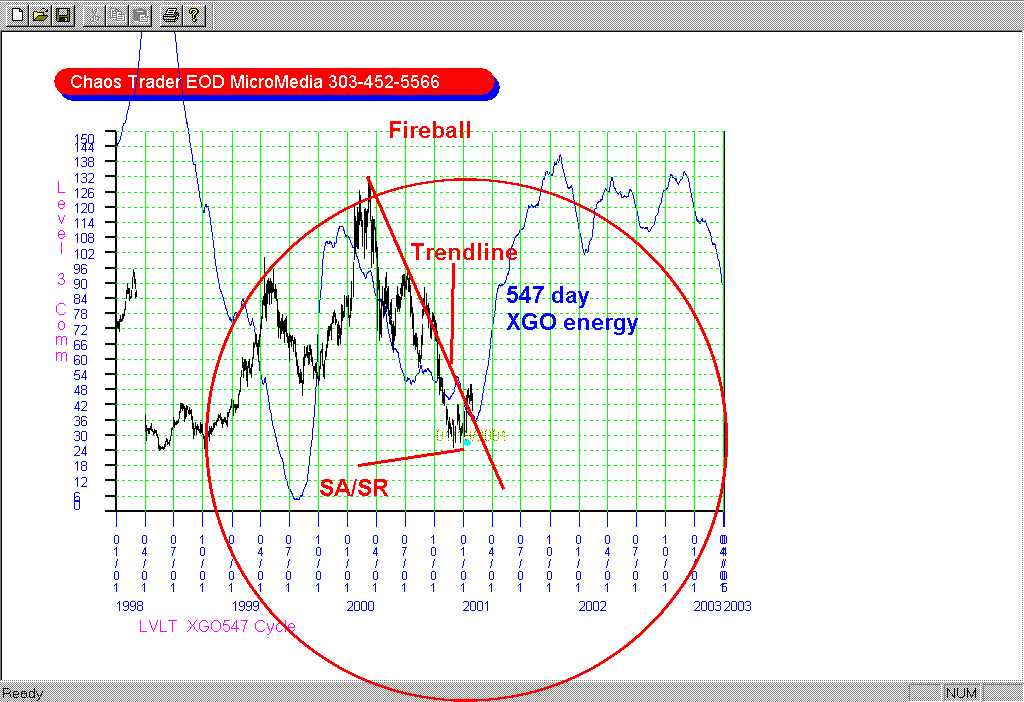
This chart shows about the only good looking chart I've seen in my stock scan.

This stock has formed a large decending converging triangle to a center, a Strange Attractor/Repellor, marked SA/SR on the chart. Since passing the center, which changes it from an attractor to a repellor, prices have rallied to break the trendline, and are now in a pullback.
Using the Magi Method, I have used the information contained in the fireball to set a Zero Delay filter to a theortically optimum length. Feeding the XGO energy into that filter produced the blue 547 day energy curve shown. It is now forecasting a nice rally.
Of course, there are no guarantees, but this is certainly a stock to watch. If it starts up, you can buy, and put a stop at the SA/SR.
If you are a FOGGER, you can see a more detailed chart in the FOGGER's room.