
March 22, 2001
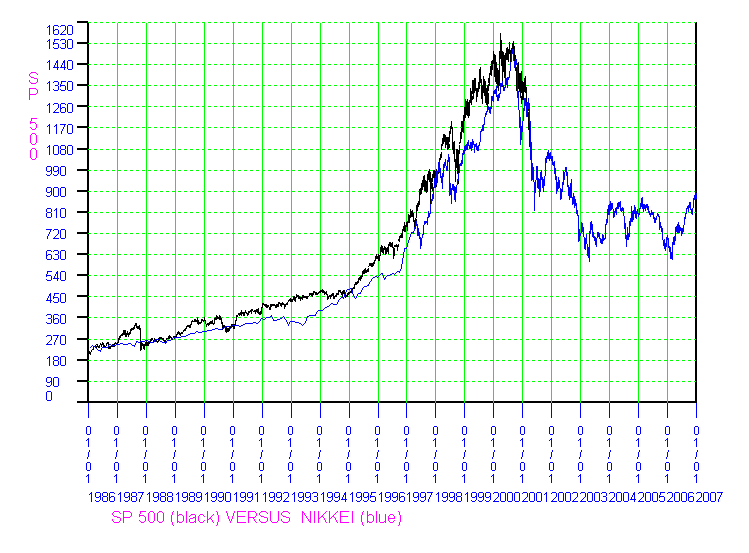
This is the scariest chart I have produced since 1987. That chart was an overlay of the 1929 and 1987 US markets, and correctly forecast the extent of the Crash of 1987.
Since the Death Line 2000 was broken, I have claimed we were in a bear market. That now seems to be an UNDERSTATEMENT. This is not a Bear Market, it is the Backside of a Mania Market. We may well be witnessing the unprecedented decline of the US stock market. It, like the Japanese market, may fall for years to come. This chart shows how that might be.

One of the purposes of studying technical analysis is to learn to recognize patterns that repeat in markets. One of the most important patterns you can learn about is the pattern of a Mania Market. The chart at the right shows two Mania Markets. The black line is the US stock market. Displayed over it in blue is the Japanese stock market, shifted forward 129 months. Both markets show a gradual rise in growth for many years. Then they reach a point (the knee) where growth accelerates. This is where the mania begins. Prices then rise rapidly as the mania spreads like the flu. Finally, the bubble bursts and prices drop sharply. After several years they level off. But they never return to their former glory days. The US has an entire generation of investors who do not understand this. Japan had such a generation, who are now wiser, humbler, and poorer. If you hold US equities, I highly recommend you convert them into cash.