
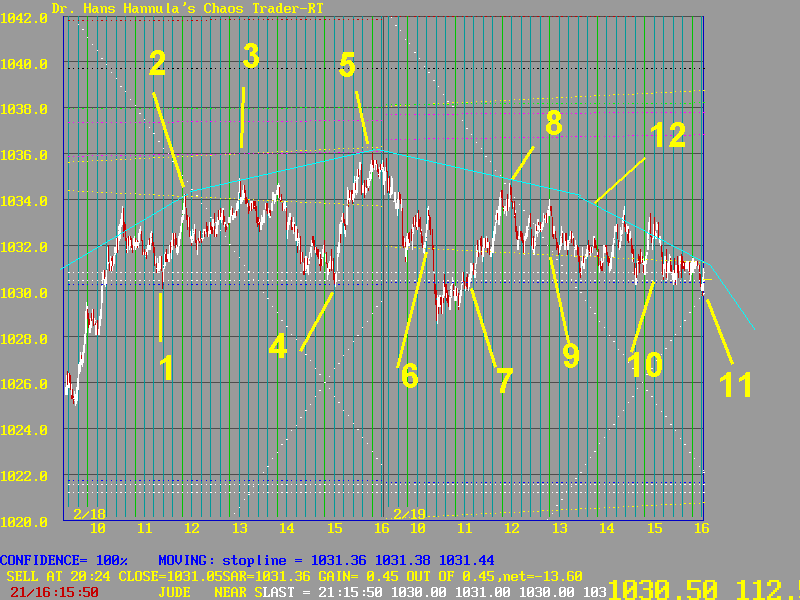
This chart shows the energy (price) vibrations brought about by Moon, Mercury, and Venus Feb 18/19, 1998. The blue Venus line at 1 formed a base support line. It was tested at 4, 7, and 10, and possibly broken at 11. The yellow Moon line stopped the rally at 2. At 3 the yellow Moon line and the magenta Mercury lines crossed as Mercury squared the Moon. Notice the spike high. At 5, prices bouced between the blue Venus line and touched the magenta Mercury line, but not the yellow Moon line. At 6, prices broke below the yellow Moon line, went an equal distance below the blue Venus line, then recovered at 7. At 8, the white Exchange line turned prices down, but they just vibrated about the Moon and Venus lines. These lines were very close, so very tightly coupled. So neither the bulls or the bears could break the balance. But notice the cyan arc along the highs. See the "roll". Tomorrow the moon line will be under the Venus line, so things will change.
Remember, chaos is the study of balance, and the breaking of balance.
![]()
![]()