
Sep 9, 1999
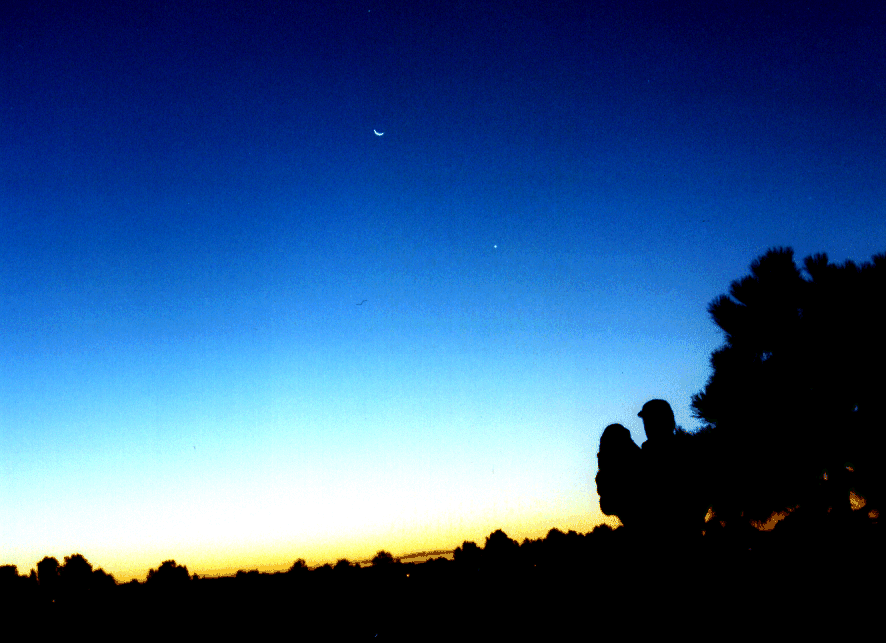
Now Ace was just there for the joy of running in HIS park, but I was sure the
sign would show up in the market.

For those of you who need a closer look, here's just the Moon and Venus.


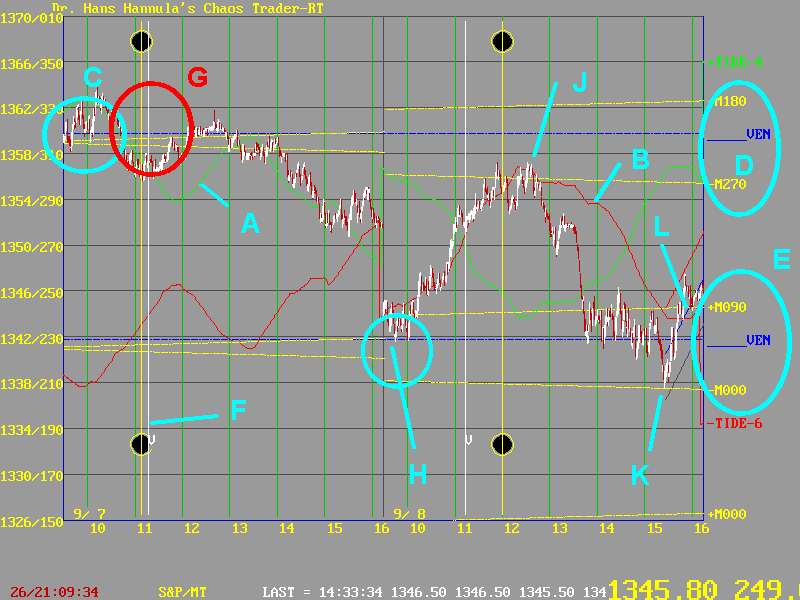
The MoonTides are shown at A and B. The market followed the normal MoonTide on the 7th, and the inverted on the 8th. Together they formed a "MoonTide Fractal Set", positioned between the two sets of electric field flux lines at C-D and H-E. These quantum flux levels were set by - can you guess? Venus and the Moon!
Prices stuck to the lines in the morning of the 7th. A small "fireball" at G, centered on the point where the Exchange passed the Moon and Venus (F), pushed prices off the upper set of flux lines, and they sagged lower into the close.
At H, prices found support after a gap down opening on the 8th. That completed one "band gap energy jump." Then prices rallied on the -MoonTide line to J, completing another bandgap jump as the Exchange lined up with the New Moon.
Then prices turned down and made yet a third jump, bottoming exactly on the -M000 Moon flux line at K. By the end of the day on the 8th, the moon flux lines were diverging. This caused another jump to the +M090 flux line at L.
When viewed in this manner, one can see that these two days of price action were very orderly, and very much determined by the Moon and Venus-just as foretold by the Rising Sign. Pretty neat, is it not?