

Ever wonder what holds prices in a congestion zone? Here's the answer.
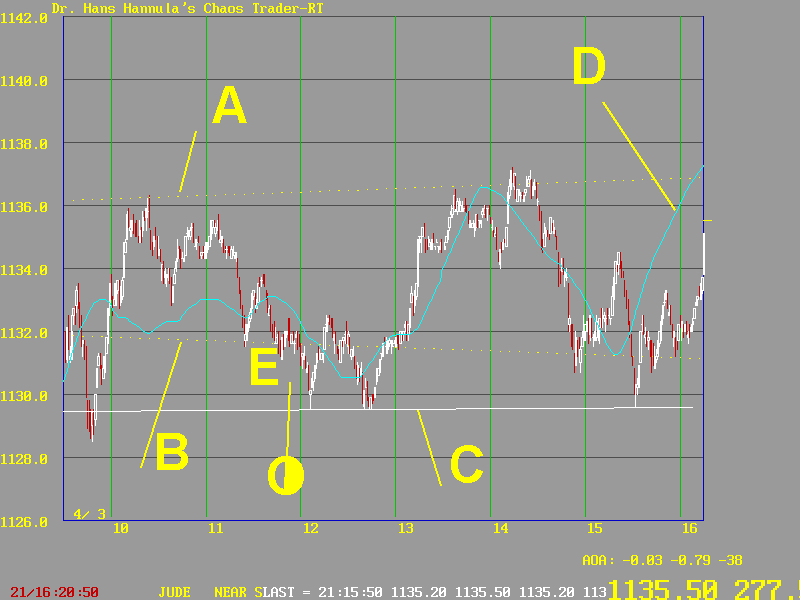
This chart shows the S&P 500 futures on April 3, 1998. Prices are the red and white candle sticks.
The dotted yellow line A is the moon's positive electric field flux line. Line B is the moon's negative electic field flux line. They formed an "energy trap" for prices. There were excursions outside the trap, but they were stopped by the white line, which is Pluto's positive electric field flux line.
The moon's field flux lines apply to all markets. They are like the ocean tides. But to find the tide in one particular bay, one needs to take into account the properties of the bay - it's personality. This is done by computing the reaction of the S&P to the moon, shown by the light blue line at D. In the past I've simply called this the moon function. Henceforth, I plan to call it MoonTide/S&P.
The S&P reacts to the moon making 0, 90,180, and 270 degree angles to the exchange. Point E marks the moon 270 to the exchange, very near a low. That, plus solar noon, caused a rally up into mid afternoon. The rally was stopped by the moon flux line.
So if you plan to trade the S&P, you "...gotta know about da moon."