
JUL 29, 1999
Over 450 years ago the French seer Nostradamus wrote,
“In the year 1999 and seven months
From the sky will come a great and terrible King
Who will revive the great King of the Angoumois,
Before and after his coming war will rule at full blast.”
This and many other writings of Nostradamus have fueled many interpretations and much speculation about the meaning of the 2 eclipses of 1999. Interpretations range from the end of the world to the dawning of the golden age, and every thing in between.
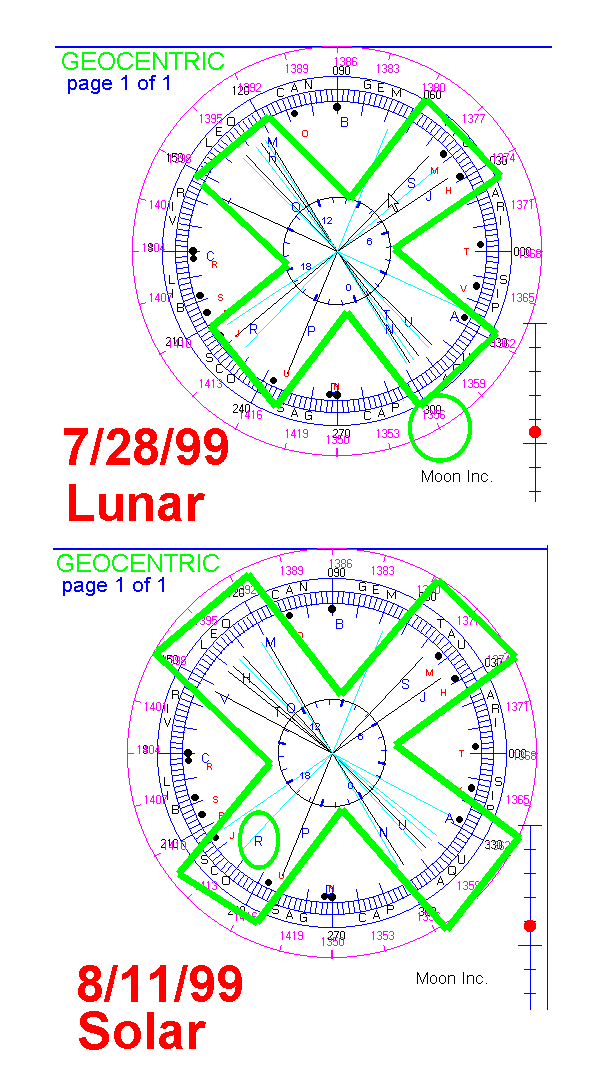
It is clear that these 2 eclipses are already having an effect on the market. The ephemeris wheels at the right show the lunar eclipse of July 28th and the solar eclipse of August 11th. Both of these are occurring with major planetary alignments. These alignments are forming a pattern called a Grand Cross. That Grand Cross is aligned with the S&P 500 natal Jupiter, Mercury, and Sun. It has already set key price points at 1428 and 1356. Those prices are very close to the high and the low of the most recent decline.
In addition to these 2 eclipses, the full Moon of August 26th should be a significant point in market prices. That is 12 years and 1 day from the August 1987 high. Watch all markets carefully in that time frame.

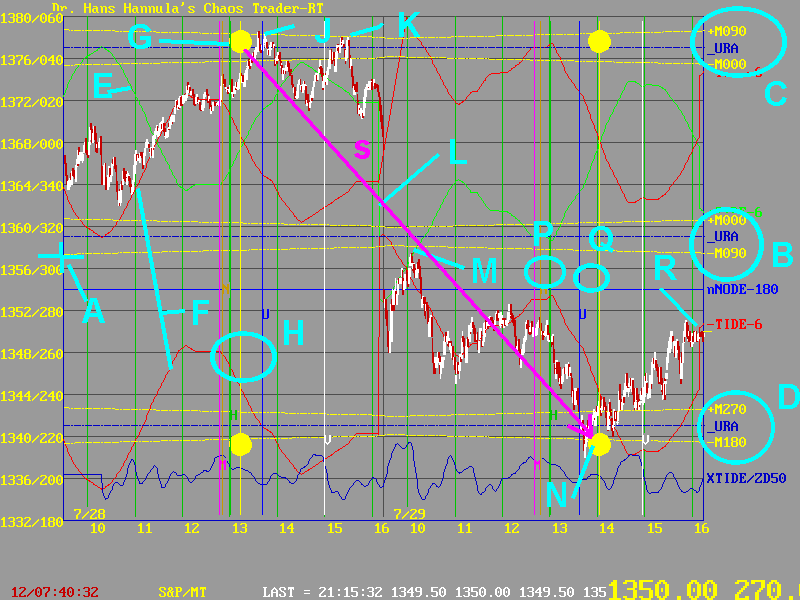
Now for a closer look at the market just after the lunar eclipse. Underlying the chaos of the past few days, which saw a wild market, and saw a disgruntled investor shoot 14 people in Atlanta, there lies a beautiful order. It is shown on this chart.
 Point A shows the price-time point of the lunar eclipse, before the
open on July 28th, at a price of 1357, set by the +M000 Moon electric
field flux line. B shows this flux line as part of a cluster, including
a line due to Uranus. C and D show the quantum levels also set by
the Moon and Uranus.
E shows the +MoonTide line. F shows two copies of the -MoonTide line. Note how these electrical tides form MoonTide Fractal Sets trapped between the quantum levels.
G shows the point where the Exchange lined up with the Full Moon on the 28th. The Moon was part of the cluster of Sun, Nepture, Uranus, and Mercury forming the Grand Cross. This is shown at H.
Prices followed the -MoonTide up to this Strange Attractor. As the Exchange passed Uranus, at J, they switched to to the +MoonTide line. The Strange Attractor became a Strange Repellor. When it did, we covered a long position on the Chaos Trader's Hotline. The market rallied to K, for a final "Good-by Kiss" of the -M000 Moon electric field flux line.
The MoonTide line, at L, forecast the gap down opening of the 29th. Notice how, overnight, the Moon flux lines had crossed. This often warns of a change in trend.
Prices rallied briefly to the -M090 flux line at M, and then dropped sharply. Our One-A-Day trade caught a nice 6 points there. Then prices continued to the point where the Exchange again lined up with the Full Moon at N, reaching the Quantum Level D. Notice how the H cluster became two clusters at P and Q. Q was Uranus and the Moon.
Prices followed the red -MoonTide on the 29th, closing at R, a Chaos Balance point of 270 degrees. So they had moved from G to N, as shown by the magenta line S. Notice how this line draws a diagonal of a square? That's a small, physical, Gann sqaure.
Now, is not that a thing of beauty?