
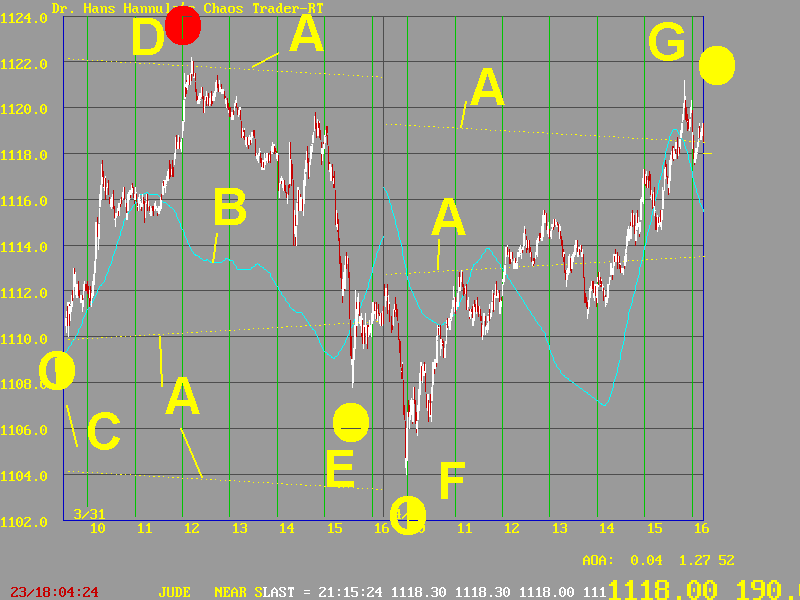
The lines marked A are the moon electric field flux lines. The curve marked B is the inverted moon function. Prices roughly followed it. Prices are show by the one minute white and red candelsticks. The quarter moon was at the Exchange before the open on March 31st. It is shown at C. Prices bottomed early on the Moon line A. They then rallied sharply until solar noon. The red ball at D is the Sun. Prices stopped on the moon flux line and headed south. They bottomed at E, as the Exchange lined up with the New Moon, the solid yellow ball.
On the 1st, the declined continued until 9:58 Eastern, precisely when the Quarter Moon at F lined up with the Exchange. They rallied, and hung around the moon flux line for a few hours. Then they rallied sharply into the close, drawn by the New Moon at G.
Pretty dramatic. It's DA MOON again!
![]()
![]()