
January 29, 1999
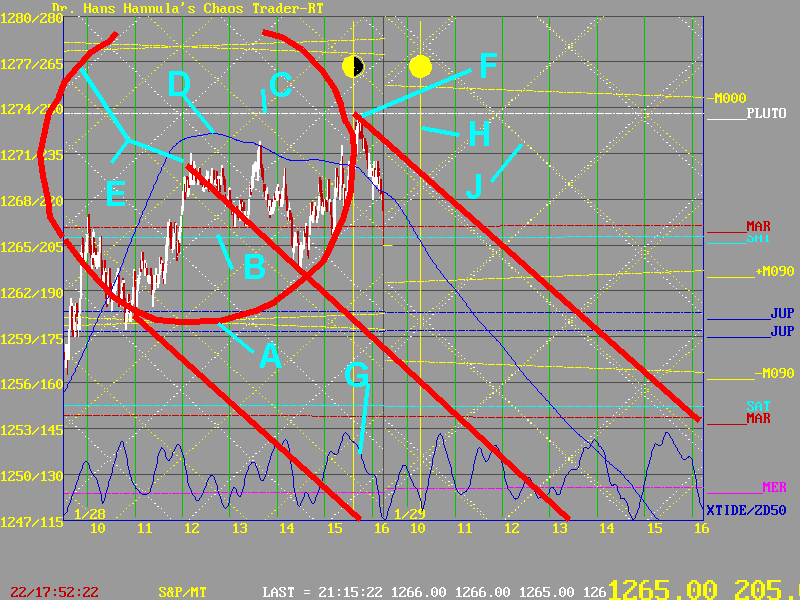
Today the Moon, with the help of some friends, made a big fireball. The blast from that explosion should be felt tomorrow. The chart below shows the details.

A points to the yellow crossing Moon electric field flux lines, close to the blue flux lines of Jupiter. B points to the dull red Mars and light blue Saturn electric field flux lines. C points to the Pluto line, which set the high. Earlier this week the Moon 180 degrees to Pluto pulled the market up.
D is the -MTZD6 6-8 day MoonTide. It called for an up move into noon, then a sag. It was a pretty good forecast.
The fireball is shown in red, with the center and outer circle pointed to by E. You can see how the market was attracted up to the center. There the fireball is acting as a STRANGE ATTRACTOR in chaos theory.
Once prices hit the center(near solar noon), the ATTRACTOR turned into a REPELLOR. They were pushed away from the center. This was a downward push until 2:30 (14:30), when the edged of the fireball popped prices up to point F. This came as the Exchange lined up with the Quarter Moon. Prices could not continue along the circle when it arced backwards in time, so they reverse sharply. Prices then dropped into the close.
This late drop was forecast by XTIDE, shown at G. XTIDE gives more detail that the basic MoonTides or the filtered MoonTides.
Note how the size of the fireball was set by the Moon. The bottom was set by the flux lines. The right side was set by the Quarter Moon vertical line.
The bright red line from the center of the fireball along the afternoon lows sets the mid-line of an Andrews Pitchfork. Two parallel red lines from the perimeter of the fireball set the top and bottom of the Andrews Pitchfork channel. Also note how that channel follows the slope of the blue -MTZD6 line ( at D) tomorrow.
Those lines line up closely with the diagonal white Exchange and yellow Moon harmonic flux lines at J. Note how tightly these lines synchronize tomorrow. Note the change from today, when they were out of phase, causing small boxes, and lots of chop. Tomorrow should be smoother.
I sold the edge of the fire ball and picked up 10 points by the close on two contracts. Knowing what is happening can give you a trading edge.
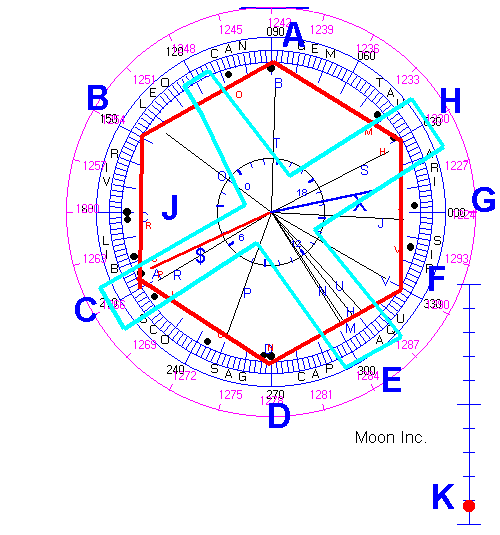
There is more to see. This chart show the Wheel of Fortune.

The S&P hexagon is shown in red. It is in the unstable vertical position. The moon is setting the top at A. The Node is setting B. Mars set the corner at C, where prices closed. The bottom at D has no current planet, but is the location of the S&P natal Neptune. That makes current Neptune more powerful.
Current Neptune, Sun, Mercury, and Uranus are clustered at E. They are part of the Grand Cross shown in light blue.
Venus sets the corner at F, opposite the Node. Saturn sets the corner at H, where it is transiting natal Sun. The moon is just coming off its maximum negative inclination, shown at K. This makes the Moon stronger.
So this hexagon is very powerful.
There is one more thing to note. Jupiter at G opposes natal Mars at J. They are on the mid-point of the vertical hexagon sides. They add to the instability. And they make the current Mars more powerful.
So if prices drop sharply tomorrow, don't believe that it was because Greenspan said Internet stocks were too high. Know that it was because the Moon threw a fireball.