
Here's why I thought this might happen.

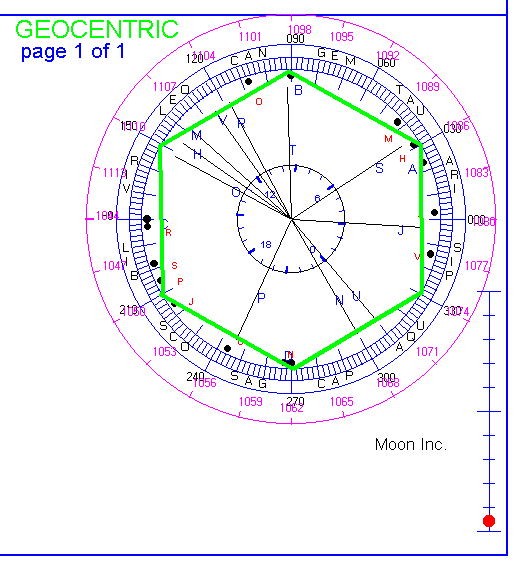
The hexagon was turned vertical by the Moon going over the top at 90 degrees. This set up a corner at 150 degrees on the Moon's Node and the Sun. Another corner was set up at 60 degrees by Saturn. Finally, the Moon's inclination was near -5 degrees. And prices had closed Friday near the 1062 bottom of the hexagon. If prices started up, they could rotate around the hexagon to the 150 degree corner going into the eclipse, as those planets tightened their alignment.
On our position trading hotline we were short. We gave instructions to cover and go long at 1062 or better, stop 1048, below the 240 degree corner of the hexagon.
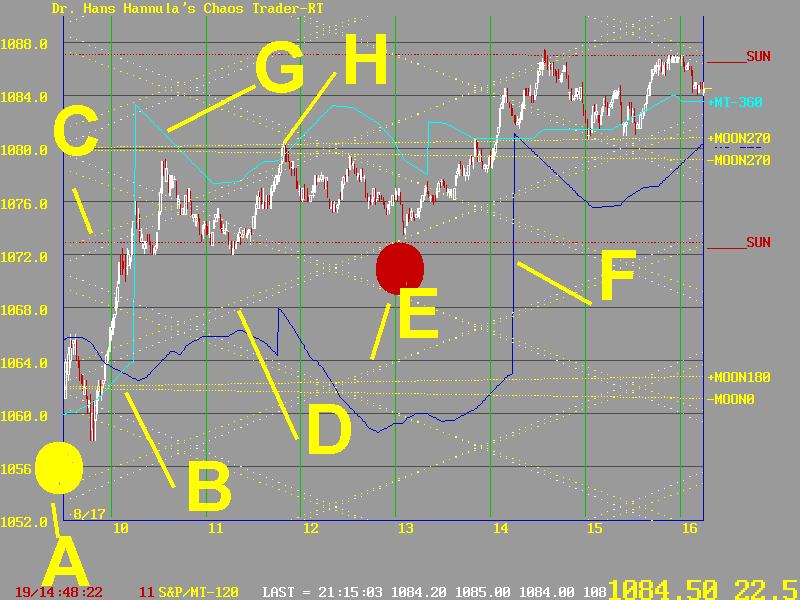
The trade worked, and we covered on the close. But I was looking at more than the hexagon. This chart form my Chaos Trader-RT program shows more of what I was looking at.

The NEW MOON was "coming into the market" as it lined up with the exchange just before the open, shown by the yellow ball at A.
The Moon electric field flux lines were overlapping at B, with the line due to the New Moon (-MOON0) and the one due the Full Moon (+MOON180) nearly on top of each other. That meant prices would either stick to this "cluster", or jump 18 points in a "bandgap energy jump" to another cluster.
The chart shows another set of energy flux lines at C and D. These, like the others, pre-exist. They are not channel lines drawn after the fact. Like the MoonTides, they are eternal, and can be computed. The white line is formed by the rotating earth. The yellow line is formed by the Moon. When these lines are this close together, it means these two bodies are very nearly sychronized. Their energy adds together smoothly.
Because Hexagon was vertical, I anticipated a 2 hour left shift in the Moon Tides, shown in by the blue line at F. So we were looking for a fast rally after passing solar noon ( the red ball at E). We got it, but unfortunately our One-A-Day trade entered too late and took a small 2 point loss.
The vertical hexagon can also shift the MoonTides left 2hours + 1/6th a day, or 6 hours, or 360 minutes. A moonTide shifted by that amount is shown by the light blue line at G. It correctly located the vertical bandgap energy jump from flux lines B to H. Next time I see this setup, I'll watch for this possibility. I just hope it's not a Monday morning.
After the bandgap jump, prices sagged into solar noon at 1:00, at E. They bottomed on the dull red horizontal flux line labelled SUN, just above 1072. They then settled into the channel formed by the sychronous fluxlines at C and D. Note that another red SUN flux line set the late highs. This makes sense, going into a solar eclipe.
I had a visitor Sunday night. We checked the overnight market. It was down near 1056, near Pluto on the ephemeris wheel. At that time, the moon was opposing Pluto. My visitor was of the view that the market could tank on Monday. By coincidence (ha ha, sure) my visitor's initials are L (Lunar) and P (Pluto). He was feeling the Pluto-Moon-opposition energy.
I knew that by morning,the moon would swing over the top, pulling prices back to 1062. After that, the rebound could be underway.
I was right, and did well on the postion trade, but not on the One-A-Day. The important thing is that I learned another lesson and made Mooney! It's all in the MoonTides. That's how the Moon built this low. It will do it again.