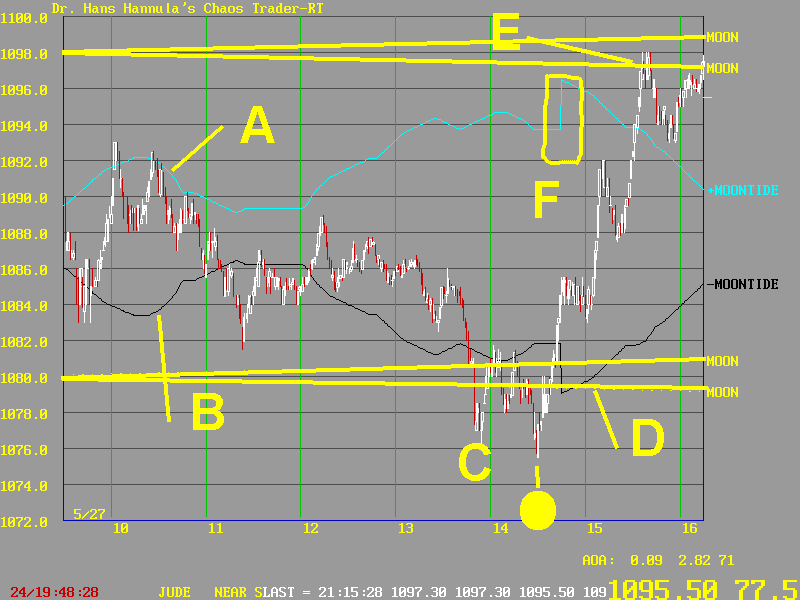


This chart shows the S&P 500 on May 27, 1998. Can you find the new moon?
The prior day was a waterfall drop, and the market opened down sharply today.
The MoonTide pattern showed a greatly reduced range from the prior day, and it held for much of the day. The morning high came near the high of the blue +MoonTide at A. Then in the afternoon, prices eased lower along the black -MoonTide line B. After solar noon, prices dropped sharply, but oscillated about the + and - Moon electric field flux lines at D.
As the Exchange lined up with the New Moon at 14:38. the mood shifted. The New Moon is shown as the yellow ball at C.
Prices began a sharp rally, doing a "band gap jump" from the Moon lines at D to the Moon lines at E. Prices moved 22 points in 90 minutes! That's fast. And it was all due to the electric field controlled by DA MOON.
This late rally started very close to the low in -MoonTide. This low was at a vertical portion of the MoonTide curve. The vertical part of the +MoonTide is shown at F. These vertical portions are "discontinuities." They often lead to fast moves, as they did here, and are often the "spark" that fires off a "band gap jump."
Pretty awesome, yes?