
To many, chaos theory is an exotic methodology that has nothing to do with markets. In reality, chaos theory is basically simply. It is applicable to all markets that are freely traded. The purpose of this series of articles is to explain the basics of chaos theory for the average trader.
Before beginning, let me differentiate between trading and investing. Investors shop for value. They typically use a buy and hold approach. They are buying something, like a stock, and holding it for the long term. Trades take the approach that timing is everything. They will buy and sell for short term gains based purely on the price action. Traders are shopping for volatility.
To be a successful trader, one needs four things. First, one needs to understand how markets behave. Second, traders needs to understand how they themselves behave, because trading is particularly susceptible to human emotions. Third, traders need perfect discipline. Successful trading requires the flawless, repeated execution of trading rules. A single transgression can put a trader out of business. Finally, traders need patience. Learning to trade is not easy. It is a very difficult undertaking which may take several years to master.
With that said, let us proceed to the topic of chaos in markets. The essential essence of chaos is balance. Any system which has more than one solution is chaotic. Markets are provably chaotic. There are mathematical tests which can test for the chaotic behavior of markets. These tests prove that chaotic behavior exists in all freely traded markets.
Let us examine the importance of balance in the behavior of chaotic
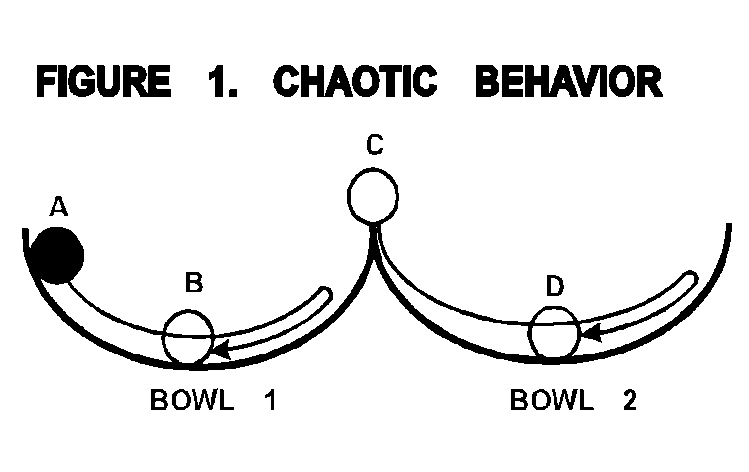
systems. Figure 1 shows two bowls that have been positioned with the rims
touching each other. Assume that the rims of these bowls are razor
sharp.

A ball dropped into this system has two possible solutions for its motion. A ball dropped into bowl one at A will roll around the bowl until settling down on the bottom at B. The bottom point is a point of rest in the system. In chaos theory, this point is called a "strange attractor." It attracts the ball toward it.
Now imagine a ball carefully balanced on the rim at C. This point is a "strange repellor." It is virtually impossible for the ball to remain at C, even if it were perfectly balanced. The slightest disturbance would tip the ball into either bowl one or bowl two. If it falls into bowl two, it will eventually come to a point of rest at the bottom of the bowl at point D. So this system has two strange attractors and one strange repellor. Each bowl represents one "domain" of behavior.
Chaotic systems exhibit balance points between the domains of behavior. The ball balanced on the rim was in a position that was deceptively stable. There seemed to be no motion. An observer may have assumed that the ball was going to stay in that position. However, once slightly disturbed one way or the other, the ball would move quickly away from this point of balance. That quick move is a chaotic move.
Markets exhibit this chaotic behavior. Markets always have two solutions. The buyers represent a force driving prices higher. The sellers represent a force driving prices lower. When the buyers and the sellers balance, prices will form a congestion zone. When that congestion zone ends, the balance has been tipped in favor of the buyers or the sellers. At that point a chaotic move occurs. That is the move that chaos traders are shopping for.
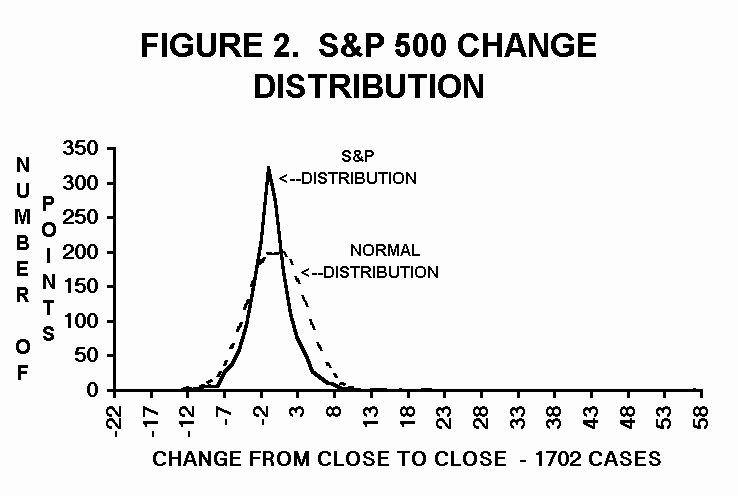
Many assume that markets are random. Not only can this be disproved by testing the price history for chaos, it can also be proved by examining the statistics of price action. Figure 2 shows the distribution of prices in the S&P 500 from the one day average. The normal statistical distribution would assume the shape of the "bell curve" shown by the dotted line. The actual price distribution does not fit this curve. The peak of the curve near zero is far higher than forecast by normal statistics. The peak is also skewed to one side. The left side of the curve falls below the normal distribution, while the right side is mostly above it. The third difference is that the tails at the extreme left and right ends of the curve exceed the normal distribution curve by a wide margin. These wide tails are the result of the chaotic breaks in markets.

Benoit Mandelbrot, an IBM mathematician, showed that chaotic systems display distribution curves like the curve in Figure 2. Such distribution curves are not described by the statistics that describe the normal bell curve. These commonly used statistics are called Gaussian statistics. Rather, chaotic systems require the use of a more exotic form of statistics know as Paretian statistics. Gaussian statistics assume that a price curve is smooth and has no gaps. Traders know that gaps exist in the price action of markets. Mandelbrot recognized this fact and showed that all chaotic systems have gaps and that they need to be described using Paretian statistics.
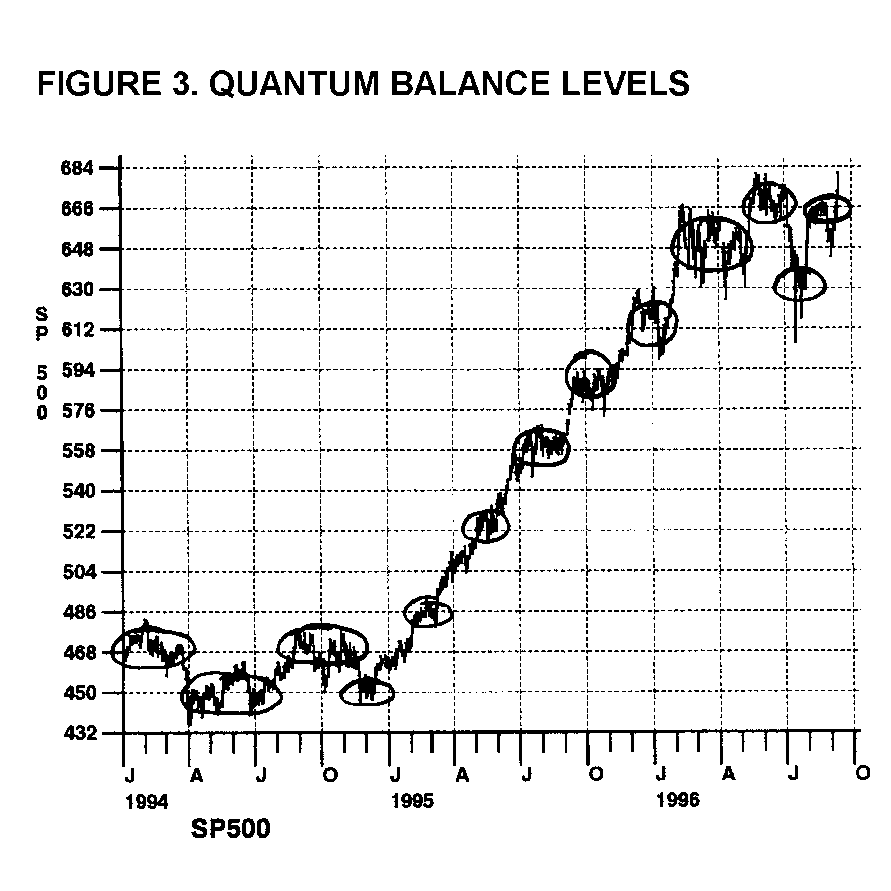
Another behavior of markets is that they show a clear quantum effect. Quantum systems have many balance states. In the structure of the atom, the electrons can exist in several different energy bands. Movement between these bands is quick and chaotic. Prices also make quick moves between energy states.
Figure 3 shows a plot of the S&P 500 with several of these balance states circled. These balance states occur in multiples of 18 points. Notice that around those levels prices tend to congest. Also notice that between those levels the transitions are often quite abrupt. This is further evidence that markets behave in a chaotic nature. A trader can use knowledge of these balance states to stay out of the market until the balance is broken, then enter the market during the transition from one energy band to the next.

These transitions are called band gap energy jumps. It is these band gap energy jumps in the physics of transistors that make our microchips work. It is also these band gap energy jumps that bring profits to chaos traders.
It is important for a trader to be able to judge the behavior of markets. The trader needs to be able to recognize a state of balance, a state of normal motion, and a state of chaotic motion.
This is not as difficult as it seems. This can be done by consistently using one exponential moving average overlaid on the price curve of one market. It is important to consistently use the same moving average for a given market. The moving average represents a condensed history of price motion. It provides a reference system, one end of a yardstick, from which price behavior can be measured.
It is also important that a trader always scale a chart the same. Unfortunately, not all commercial software permits full control of the scaling of charts. Such full control is absolutely essential to developing judgment of price behavior. A well scaled chart will fix the number of points per day and keep it constant. This means that motion at a given rate will always appear the same. It is this rate of motion that is important to the chaos trader.
There are three types of motion of interest to the chaos trader. The first type is a flat or choppy market. This is a market going nowhere, neither up nor down. The second type is a normally trending move. Motion is steady and orderly. The third type of motion is a chaotic breakaway move.
On a reasonably scaled chart, these moves can be identified by their rate of motion. This can be easily seen by observing the slope of the moving average. The choppy, flat market will have a slope less than 15 degrees. A trending market will have a slope near 30 degrees. A breakaway move will have a slope near 60 degrees.
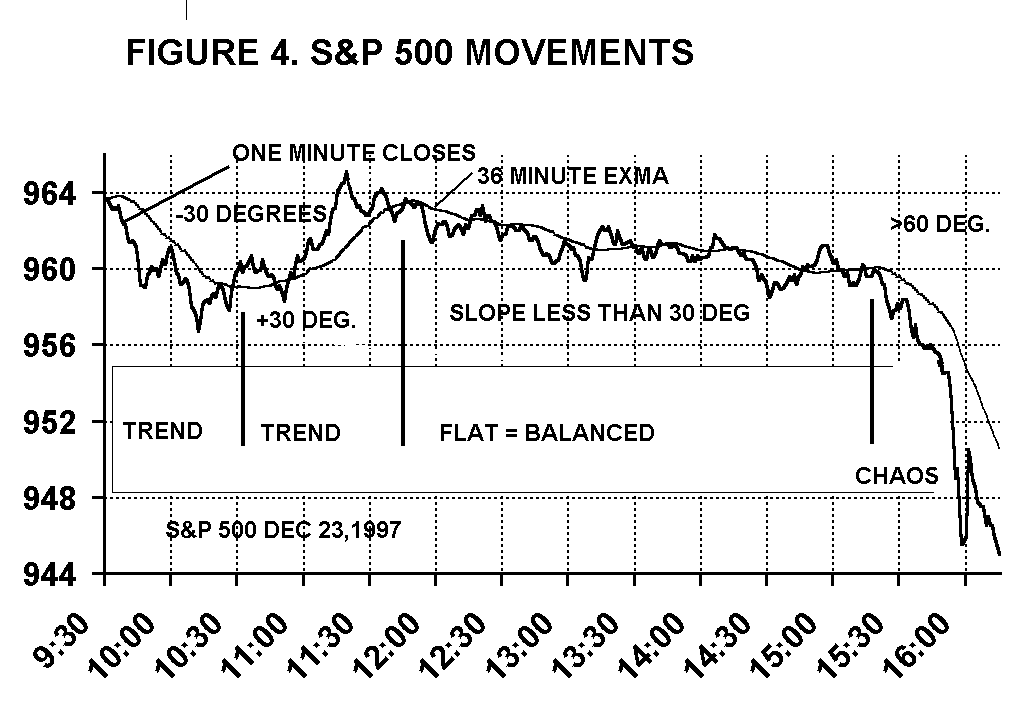
Figure 4 shows an intraday chart of the S&P 500 futures. Industrials. Prices are shown as the one minute closing prices. A 36 minute moving average provides a reference.

Early in the day, the market trended down, then up. Then it went flat for over three hours. These dull periods cause many traders to loose interest. Chaos traders know that such balance is often a precursor to chaos. Late in the day, the market dropped a few points. This increased the slope of the moving average to more than 60 degrees, identifying a chaotic, breakaway move. Even as late as 15:30 (3:30) Eastern, a trader could have joined the breakaway move for a 12 point gain. These chaotic breaks are fun and profitable to catch.
On intraday charts, traders will find a 36 minute moving average to be a good reference. Price scaling of a multiple of $100 per hour works well. For example, a two or four point per hour scale works on S&P intraday charts. On daily charts, a 21 trading day moving average and a one point per day scale works for most stocks and commodities. These are beginning points. Experiment to find a good scale, then stick with it.
This consistent use of an exponential moving average on reasonable scaled charts will give the chaos trader the ability quickly look at a market and judge whether it is balanced in a choppy state, trending at a moderate rate, or going chaotic in a breakaway move. With experience, a chaos trader can recognize the transition to the breakaway moves and trade in the direction of the move, maximizing the profits per time spent trading.
Markets are chaotic. They constantly balance and congest, then break to another balance level. Chaos theory describes this behavior well. A trader can use a reference moving average to classify market motion into flat, trending, or chaotic.
Chaotic markets also form patterns know as fractals. In the next article we will discuss the most basic form of a market fractal, the Chaos Clamshell.