![]()
![]()
********************************************************************************
S&P Turns Down
Chaos Clinic for 11/20/2020
********************************************************************************
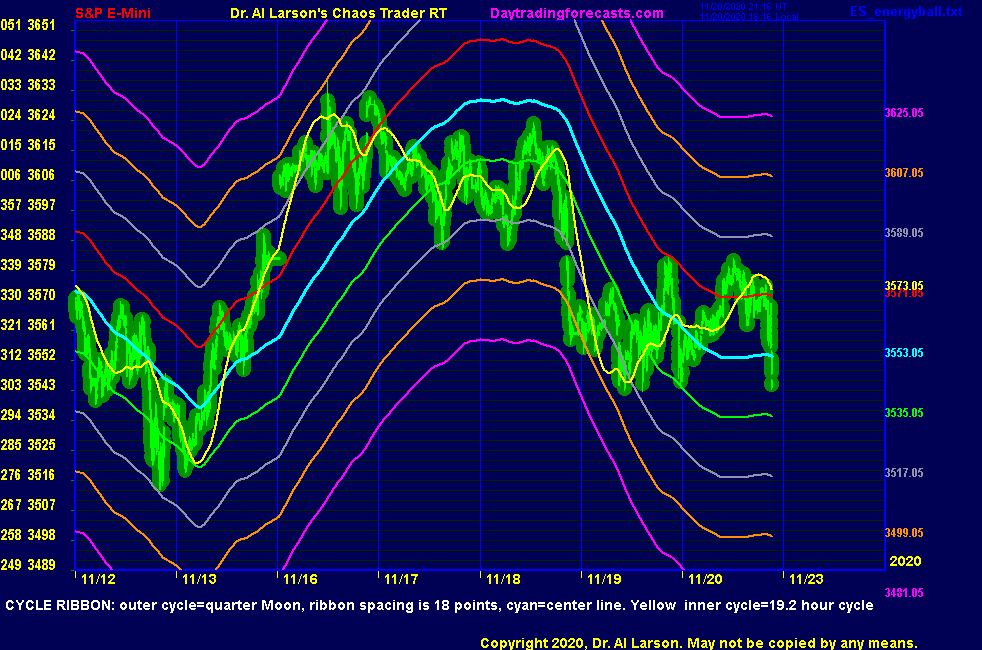
In last week's Chaos Clinic I said "But it does look like the blow off move has stalled, and a down turn
may be just ahead." I was half right. The S&P climbed above the stall area. Then it turned down this week.
This is shown on the chart above. This is an 8 day plasma chart. For more on plasma charts, see
my YouTube video.
Overlaid on the chart is a product of my research: A Cycle Ribbon. This expands the use of a cycle tracker
by using harmonic bands about a central plot of the cycle. The cyan line in the middle is the basic
cycle. Above and below that central cycle are plots offset by multiples of 18 points.
These offsets make it possible to use the longer term cycle to help determine shorter term behavior.
The Cycle Ribbon is tuned to a quarter of a Moon cycle, roughly a week. This makes it sensitive enough
to catch the frequent changes encountered in the S&P. Supplementing this Cycle Ribbon is a short
term cycle filter set to track cycle of 19.2 hours. It is the yellow line.
Starting on the left of the chart, November 12, the ribbon of cycles was down. The late decline dropped
below the cyan centerline, and nearly to the gray -36 point ribbon line. Then the last hour rally
bounced prices back up to the cyan centerline, which repelled it downward.The yellow cycle remained down.
On the 13th, prices continued down to the green -18 ribbon line, basically a 50% pullback Then the yellow cycle
turned up sharply, and the entire ribbon turned up as well. Before the normal session, prices made it up to the
red ribbon +36 level.Then prices sagged back to the cyan ribbon centerline. Significantly, the yellow cycle
continued up. So after I and many others quit for the day, prices rallied into the close, with the plasma edge
nearly reaching the gray +36 ribbon level. So the Thu8rsday-Friday move was basically a -36 gray to +36 gray
balanced move. The up slope of the ribbon suggested not holding any shorts over the weekend.
On Monday the 16th, prices did trade higher early, just touching the gold +54 ribbon level.Then they chopped
lower, getting a late bounce near the cyan center level. Prices ended the day with a gap up after normal hours.
falling just short of the gray +36 ribbon level.
On the 17th, prices traded lower,. all the way down to the -36 gray ribbon level, another balanced gray to gray swing.
They bounced up in the afternoon, but stalled as the entire Cycle Ribbon slowed its up trend. This
was the first sign of a possible longer cycle down turn.
On the 18th, prices rallied from the -36 gray level, peaking before the normal session. This turned the yellow cycle
up, but the entire ribbon was turning down, showing the Quarter Moon cycle was turning down. When prices moved
below the green ribbon -36 level, it was clear a sharp drop could materialize. It did, in a trade that was good for
+42 points on a MoonTide trade. The decline stopped near the gold -54 level, a balance with the +54 level of Monday.
Thursday the 19th was a choppy congestion day. On the ribbon. prices turned up on the gray -36 level, as the yellow
cycle turned up. It looked like prices would again turn down at the cyan center line, but late in the day prices
popped up almost to the down sloping red +18 level. From the gold -54 level, this was a +72 move, a 5th of a circle move.
As prices hovered below this down red ribbon line, the plasma edge "beveled down." This suggested an end of the correction
and a drop. The drop went quickly down to the green -18 ribbon line, at the end of the day, again a balance.
As this is being published on Friday the 20th at 8 AM Eastern, the Quarter Moon cycle has flattened and the yellow
cycle has turned up. With yesterday's low being on the gray -36 line, one could anticipate resistance at the
grey +36 line.
For more on my work see
Moneytide.com
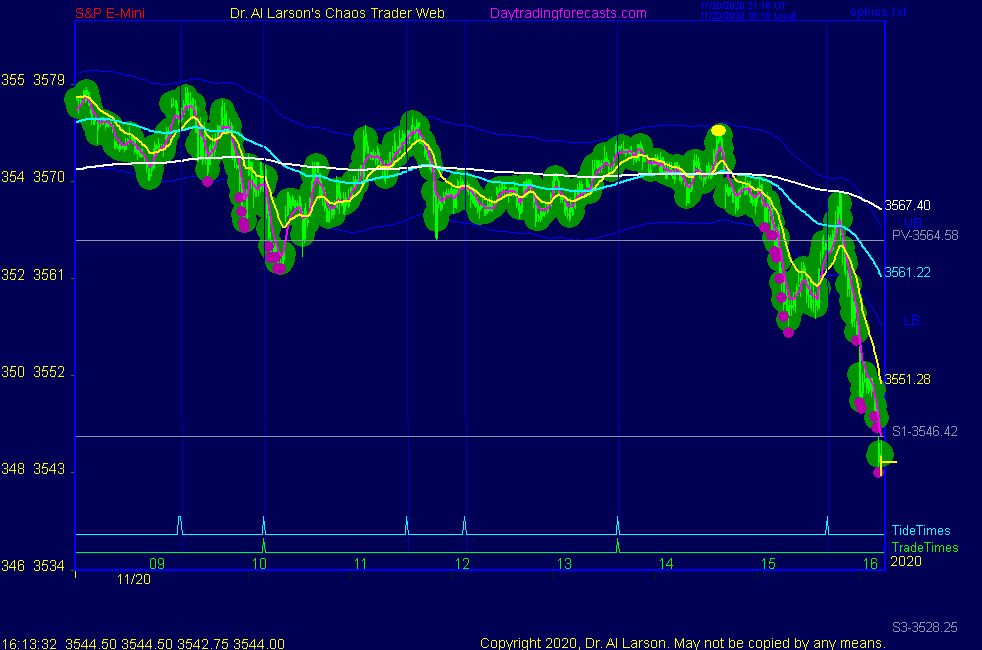
11/20/2020 2:13:50 PM MT Al****:: have a good weekend all
11/20/2020 2:10:18 PM MT Al****:: now the Cycle Ribbon has continued down, so this week's high looks like it could hold a while. I will carry my 3568 trade as a swing trade with a can't loose stop at 3567.
11/20/2020 2:00:51 PM MT Al****:: down to the cyan Cycle Ribbon center line
11/20/2020 1:59:27 PM MT Al****:: now the plasma tube is expanding downward
11/20/2020 1:56:25 PM MT Al****:: You are welcome Jim
11/20/2020 1:53:34 PM MT Al****:: didn't leave-resold 3568
11/20/2020 1:53:03 PM MT jvj****:: Thanks for the commentary Al
11/20/2020 1:46:51 PM MT Al****:: stopped for big +4.5 - now done
11/20/2020 1:35:47 PM MT Al****:: that's based on the Wednesday drop going down 2 ribbon levels
11/20/2020 1:33:17 PM MT Al****:: moved that down to 3536 green level on the Cycle Ribbon
11/20/2020 1:28:48 PM MT Al****:: Flash Boys sold pivot-putting buy limit at 3547 s1
11/20/2020 1:21:32 PM MT Al****:: stop to 3567
11/20/2020 1:14:51 PM MT Al****:: stop to 3568.75
11/20/2020 1:10:24 PM MT Al****:: stop to 3571.25
11/20/2020 1:08:33 PM MT Al****:: stop to 3573
11/20/2020 1:03:34 PM MT Al****:: here I'm watching for the plasma halo to expand downward
11/20/2020 12:50:44 PM MT Al****:: what brought me back was the isolated push ball on the 4th chart on the SPKISS page
11/20/2020 12:44:36 PM MT Al****:: stop 3575.25
11/20/2020 12:43:13 PM MT Al****:: sold 3571.5
11/20/2020 12:40:52 PM MT Al****:: or not-sticking around
11/20/2020 12:37:28 PM MT Al****:: OK, holding up to close. I'm done. Have a good weekend. See you in two weeks.
11/20/2020 12:16:09 PM MT qq:: So much for my opinion re it following XTide2Plus
11/20/2020 12:11:25 PM MT qq:: I see looking re curled down if it's 2 days ago. I was looking short term.
11/20/2020 12:06:38 PM MT Al****:: yellow cycle clearly curled down
11/20/2020 11:39:05 AM MT qq:: Moving up on XTide2Plus green
11/20/2020 11:34:08 AM MT qq:: It looks like that AUX yellow cycle has turned up
11/20/2020 11:08:52 AM MT Al****:: on the AUX page chart the yellow cycle is turning down
11/20/2020 11:08:11 AM MT Al****:: normally on Friday I'd call it quits now, but the possibility of a late drop has me still watching to see what happens after the last trade time
11/20/2020 10:50:33 AM MT Al****:: looking weak
11/20/2020 10:40:02 AM MT Al****:: today is very similar to Wednesday
11/20/2020 10:23:49 AM MT Al****:: on the Secret->esnat360 chart the green vibration level is 3531, close to the Cycle Ribbon green of 3535
these are possible if we get a break down
11/20/2020 10:15:33 AM MT Al****:: note the vertical lines on the Secret charts - these can add energy
11/20/2020 10:13:21 AM MT Al****:: on the MTRainbow chart the longer EXMA's are down and bar color is red
11/20/2020 9:59:17 AM MT Al****:: took the dogs to the park - see plasma oozing downward
11/20/2020 9:41:12 AM MT Al****:: updated my chart in the CCT Room
11/20/2020 9:33:33 AM MT Al****:: the AUX page plasma chart still shows yellow cycle up, but longer cycle pretty flat
Flash Boys sold prices down to the pivot and bought a bit
11/20/2020 8:28:31 AM MT Al****:: on the SPKISS page the longer EXMAs have turned down
11/20/2020 7:56:18 AM MT Al****:: Face Of God pattern that I posted looks good
11/20/2020 7:54:25 AM MT Al****:: looks like it may break down - if so cyan level 3552 likely
11/20/2020 7:32:40 AM MT Al****:: things change when the normal session opens. Overnight moves have low volume. The normal session has higher volume and can confirm or reverse the overnight move.
11/20/2020 7:12:44 AM MT Al****:: Another feature of plasma charts is plasma gaps. These occur during
vertical moves when the halo of of the plasma is not continuous. Such a gap occurred Wednesday's drop, near 3583. That level acts as resistance.
11/20/2020 7:02:43 AM MT Al****:: Plasma charts are particularly good for use with the Face Of God pattern. I have posted an example in the CCT Room
11/20/2020 6:56:43 AM MT Al****:: now note that the plasma halo is growing downward, and prices are poised to possibly break below the yellow cycle and the red ribbon level
11/20/2020 6:44:03 AM MT Al****:: today the AUX page chart is live. Note one feature of a plasma chart is that it smooths without loosing detail. Compare this mornings high with yesterdays late high. Today's is pointed.
11/20/2020 6:07:17 AM MT Al****:: Good Morning visitors. Welcome to the Chaos Clinic.
The written Chaos Clinic is on the AUX page.
This site has a lot of charts,
so you may find it useful to have several of them available within your
browser. If you have a tabbed browser, you can open separate charts
in separate tabs by right clicking on any link, and selecting "open in new tab"
from the menu. The main list of site pages is at
http://daytradingforecasts.com/chartlistsec.asp
Recommended pages to watch are SPKISS, MTRainbow, and Chat.
For astro stuff, add SPSunMoon, Wheel, and Chaos Clinic.
A special set of Dr. Al's research charts are on the Secret page.
Comments in the chat room are announced by a
"duck call" noise. This noise also occurs when the sofware detects a
resonant hex pattern on the Wheel page. MoonTide trading tutorials
are on the right side of the ListOfCharts page. One should
read Trading the MoonTide Tutorial and Keep it Simple as a minimum.
Many subcribers do not strictly trade the MoonTides, but use the charts on this
site as input to their own trading strategies. For example, the bottom chart on the
SPKiss page is good starting point for swing traders.
Also on this site is the Certified Chaos Trader's Room. That room is open
to graduates of my 4 main courses. See http://moneytide.com -> Courses for details.
9:00 Eastern-System: No comments
![]()
![]()