![]()
![]()
********************************************************************************
젨젨쟃old and Silver Set To Rally
젨젨잺haos Clinic for 10/18/2019
********************************************************************************
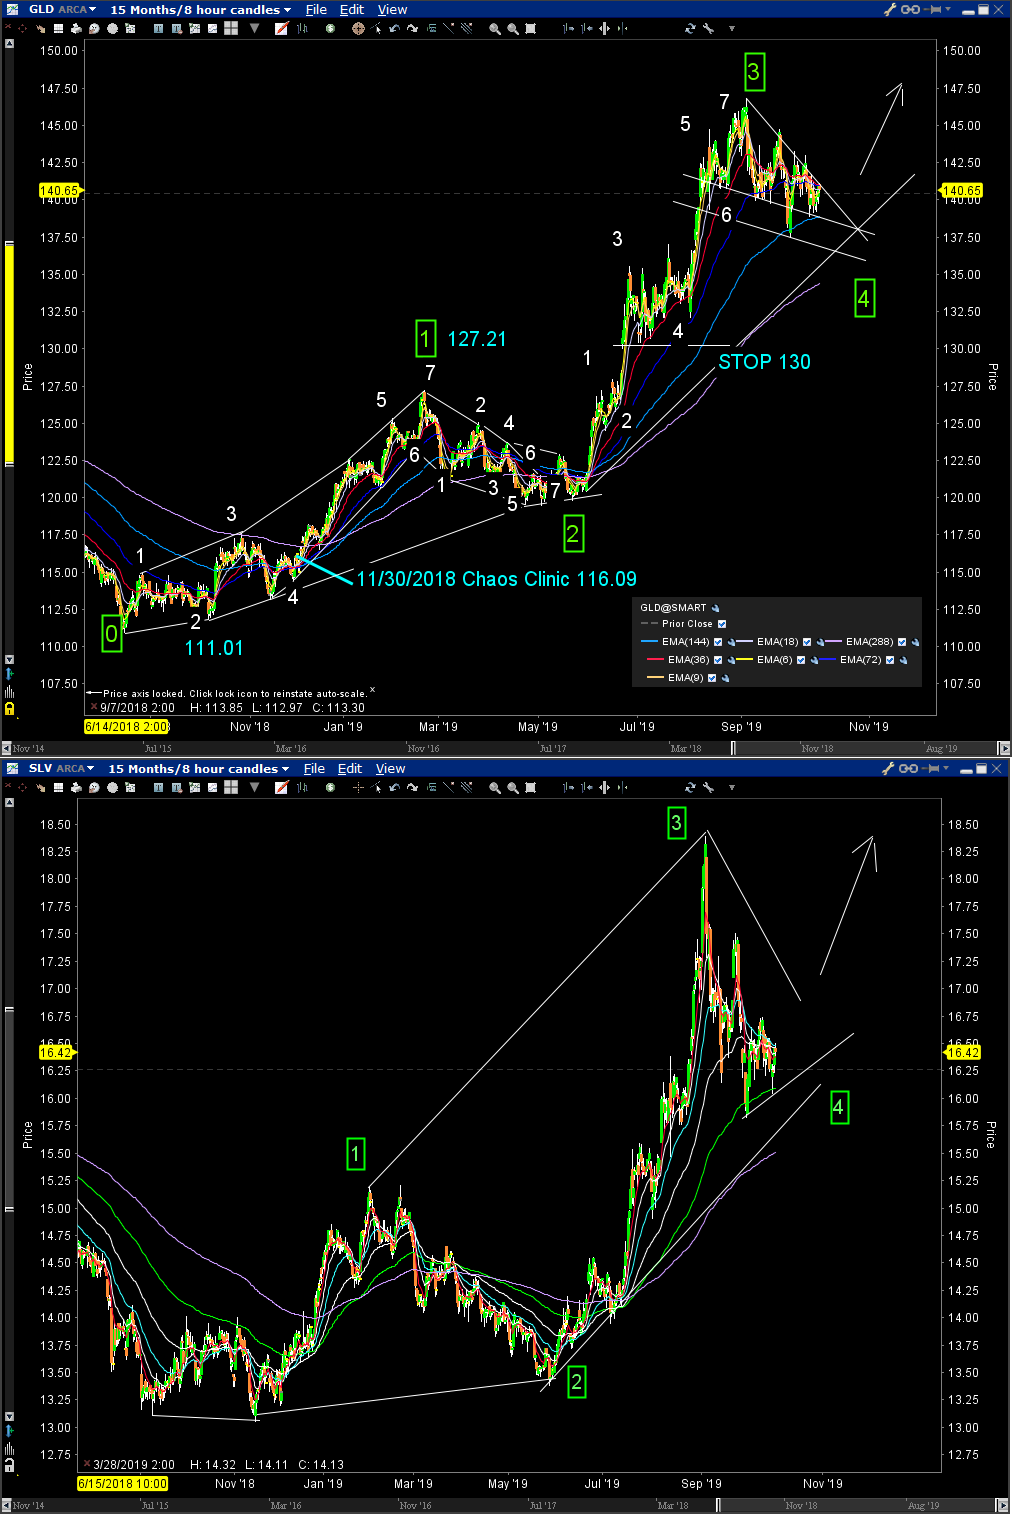
While the S&P has gyrated wildy since early 2018, gold and silver have both
traded in a clearer, calmer, more profitable manner. They both are set to advance
soon.
These two charts show gold and silver over the past 15 months. The both made bottoms
in the fall of 2018, then rallied to make a move 1 of 7 moves in an up Chaos Clamshell.
After this spring top, both pulled back into an early summer move 2. Both rallied
strongly up into September highs,
Since then, both have traded in a sideways move 4 congestion. The congestions have been
very orderly, and predicatble. They represent a buying opportunity. As a rough estimate.
Move 4 is about half way timewise in a Chaos Clinic, so there is probably 12 to 15 months
left in the patterns.
Move 5 is usually the biggest move in a Chaos Clamshell, so it is a good one to trade,
Like all trades, there are risks, and one must use stops, I highly recommend trading
these longer term patterns with Exchange Traded Funds, such as the GLD and SLV shown.
Unlike options, there is no time window within which you must win or loose. Natural
cycles can run months or years, and using EFTs lets you capitalize on them. Furter,
EFTs are fine grain: one can trade one $144 GLD or one $16.50 SLV, or thousands of each.
That makes them not only good vehicles for experienced traders, but for newbies, who can
trade small while they learn.
Chaos Clamshells are taught in my Cash In On Chaos course.
All my courses, including a free online mini course called Trading The Chaos Clamshell
can be found at
http://moneytide.com/hans/institute.asp
For more on my work, see Moneytide.com
10/18/2019 1:13:59 PM MT Al****:: for two days I see 1234, leaving 5 for Monday after the Brexit vote fails in Parliament :)
Have a good weekend all, take some courses
10/18/2019 1:10:45 PM MT clb****:: I agree. The last hour is about as fun as watching paint dry. It looks like the people that always want to go home long on Fri. are keeping it afloat. Have a good weekend everyone.
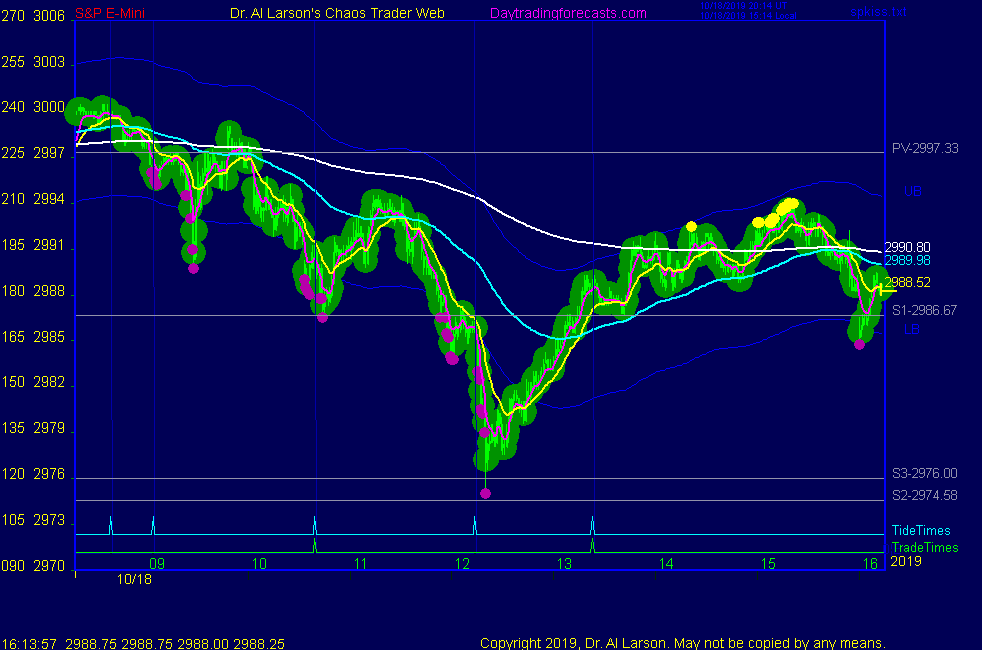
10/18/2019 1:07:00 PM MT Al****:: not sure it's worth trading this late, but from low see 7 small moves, last 4 makin g3 drives to a top
10/18/2019 12:49:36 PM MT clb****:: There are 6 waves from the peak at 8:00 ET this morning. There may be a 7th down wave still left. Lower highs, and lower lows in the pattern so far. Trend is still down.
10/18/2019 12:18:24 PM MT clb****:: 2990 was yesterday morning's support, as well as support last night. It looks like possible resistance now.
10/18/2019 12:11:17 PM MT clb****:: Thanks, It may be a "hook and go" trade. I am hesitant to buy here.
10/18/2019 12:06:37 PM MT Al****:: clb: you're hot today; well done
10/18/2019 10:52:38 AM MT clb****:: Looks like a possible continuation sell at the next tide time.
10/18/2019 10:50:12 AM MT clb****:: I have noticed that if the market peaks near a full moon, there is usually a 3-5 day sell. If yesterday was a peak, that is where I am getting the 10/24 date. The reverse is true for markets bottoming near a full moon.
10/18/2019 10:49:05 AM MT Al****:: On the last chart on the SPKISS page there are a nice "Three drives to a top" - I also pointed this out yesterday
A 14 day equal time down move takes to Halloween
10/18/2019 10:38:25 AM MT clb****:: Thanks Dr. Larson. My daily analysis shows downward pressure until 10/24 +/- 3 days. This whole week has looked like a rounded top.
10/18/2019 10:35:36 AM MT Al****::
Yesterday I pointed out a possible majoe top in the chat room:
"10/17/2019 11:00:55 Eastern 9/23 to 10/3 = 14 days; 10/3 to 10/17 = 14 days; 1/2 Moon cycle
12:08:28 Eastern If we break yesterday's lows, we could see a major decline lasting two weeks or more."
10/18/2019 10:32:10 AM MT clb****:: Covering for 12. I think there may be a short term bounce here. There is congestion all the way back to Sep. 25 here.
10/18/2019 10:19:44 AM MT clb****:: Minor support @ 2970, but more support @ 2955. Market has the potential for a decent sell today.
10/18/2019 10:11:18 AM MT aa:: Correction on overall TICKS. Ticks overall down till 11:30EDT and then what looks like a possible swing up
10/18/2019 10:05:01 AM MT aa:: bew: refering to a dip indicated by NY TICKS. Sure glad I took a 30 minute walk to clear my head. The overall TICKS since trade time have indicated up. Possible bottom soon.
10/18/2019 9:57:34 AM MT clb****:: Need to break 2982 to get a sell-off going. After that, a near term sell to support @ 2870-2900 seems reasonable.
10/18/2019 9:53:48 AM MT clb****:: Momentum has basically been flat since Oct 14. On a 30 minute chart of ES ADXR is rising above 20, indicating a down trend is starting. Unless something else happens to indicate otherwise, yesterday looks to be a relative high.
10/18/2019 9:38:20 AM MT bew:: what dip are you referring to?
10/18/2019 9:27:46 AM MT aa:: Dip looks short. More bullish than bear
10/18/2019 9:24:36 AM MT aa:: But now TICKS moving down for possible dip
10/18/2019 9:16:49 AM MT aa:: TICKS have been swing up last 2 minutes. It sure gives me an edge
10/18/2019 9:15:35 AM MT aa:: Also love instead of low
10/18/2019 9:15:10 AM MT aa:: Also low this split second TICKS update:
https://www.barchart.com/stocks/quotes/$TICK/interactive-chart
10/18/2019 9:14:16 AM MT aa:: P/C three ways: https://www.nasdaq.com/market-activity/isee-index
10/18/2019 8:50:44 AM MT clb****:: BOG, try this link https://markets.cboe.com/us/options/market_statistics/daily/
I don't know if this is what you are looking for, but it does list index PC ratios through yesterday 10/17.
10/18/2019 8:38:54 AM MT BOG****:: Good Morning Dr. Al and Members, Please does anyone know where I can get daily live data info of put to call ratio, or get get M-W-F put to call ratio either free or subscription? Thanks
10/18/2019 7:01:28 AM MT Al****:: I have placed a Face Of God chart in the Certified Chaos Trader's Room. That room is open
to graduates of my 4 main courses. See http://moneytide.com -> Courses for details.
eMylar Fractal of Pi overlays help you be patient, since they show you future potential moves.
The best bargain in my courses is to take the Cash In On Chaos and Fractal of Pi courses and
learn to use the FOP overlay. Then take Chaos Trading Made Easy, and finish with Face Of God.
10/18/2019 7:00:13 AM MT Al****::
9:00 Good Morning. Welcome to the Chaos Clinic. This site has a lot of charts,
so you may find it useful to have several of them available within your
browser. If you have a tabbed browser, you can open separate charts
in separate tabs by right clicking on any link, and selecting "open in new tab"
from the menu. The main list of site pages is at
http://daytradingforecasts.com/chartlistsec.asp
Recommended pages to watch are SPKISS, MTRainbow, and Chat.
For astro stuff, add SPSunMoonMer, Wheel, and Chaos Clinic.
Chaos clinic comments appear at the bottom of the SPKISS, MTRainbow,
and ChaosClinic pages. Comments in the chat room are announced by a
"duck call" noise. This noise also occurs when the sofware detects a
resonant hex pattern on the Wheel page. Trading tutorials
are on the right side of the ListOfCharts page. One should
read Trading the MoonTide Tutorial and Keep it Simple as a minimum.
10/18/2019 6:58:45 AM MT jvj****:: Good Morning, Al, nice charts on Aux page.
10/18/2019 6:00:55 AM MT Al****:: GM all-good luck today
Chaos Clinic posted on AUX page
9:00 Eastern-System: No comments
![]()
![]()