![]()
![]()
********************************************************************************
Gold Set to Rally
Chaos Clinic for 10/2/2020
********************************************************************************
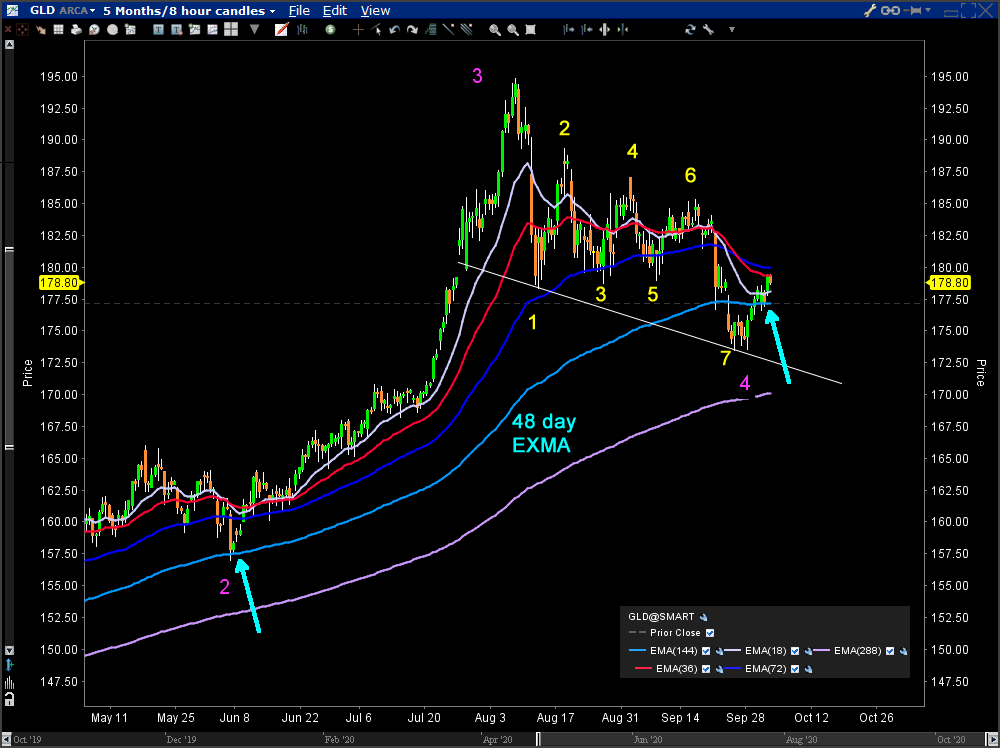
This is a 5 month 8 hour bar chart of the gold exchange traded fund GLD.
For over two years, gold has been going up, as money flows out of riskier markets.
During June and and July, GLD soared. Then it started a pullback. That pullback
now looks to be over.
Gold is in a larger Chaos Clamshell of which moves 2, 3, and 4 are shown by magenta
numbers. Within move 4 down, there are 7 moves numbered in yellow.
Further evidence is provided by the 48 day EXMA. At the magenta 2 low prices bounced sharply off
the EXMA. At the magenta 4 low, prices penetrated the EXMA,but rebounded above it. This is a sign of strength.
You can learn more about my work at
Moneytide.com
10/2/2020 12:15:25 PM MT Al****:: I'm holding this as a swing trade stop 3390 above high of the week
so now signing off-have a good weekend
10/2/2020 12:00:06 PM MT Al****:: the last chart on the SPKISS page looks like a 1-2-3-4 of a larger pattern
10/2/2020 11:51:10 AM MT Al****:: ok, didn't leave just yet - sell going into last trade time
sold 42
10/2/2020 11:41:18 AM MT Al****:: stopped out - done for the day-thanks for coming-see you next week
10/2/2020 11:39:12 AM MT Al****:: dip was to S1 and white vibe on esnat72
10/2/2020 11:37:51 AM MT Al****:: stop sill ok so just waiting
10/2/2020 11:24:45 AM MT Al****:: now the exmas are looking better
10/2/2020 11:19:28 AM MT Al****:: need to be patient
10/2/2020 11:11:30 AM MT Al****:: prices found support on the 11 minute exma-my stop is just below it
10/2/2020 11:01:37 AM MT Al****:: or higher - on esnat72 have hit 2 white vibe levels - could reach the third
10/2/2020 10:58:19 AM MT Al****:: stop 46 - I expect prices to reach the pivot at 67
10/2/2020 10:55:50 AM MT Al****:: no I cancelled the sell limit when i was stopped out
10/2/2020 10:51:20 AM MT LL:: Al on your first trade you Had a sell limit at 60,is this also valid for your last trade or different View dir this trade?
10/2/2020 10:37:33 AM MT Al****:: my entry was 53.25 stop 35
10/2/2020 10:20:48 AM MT Al****:: I took that as a buy on the second trade time
10/2/2020 10:15:45 AM MT Al****:: these rapid swings are typical of days with these 3 vertical lines on the Secret charts - I call them "confusion days"
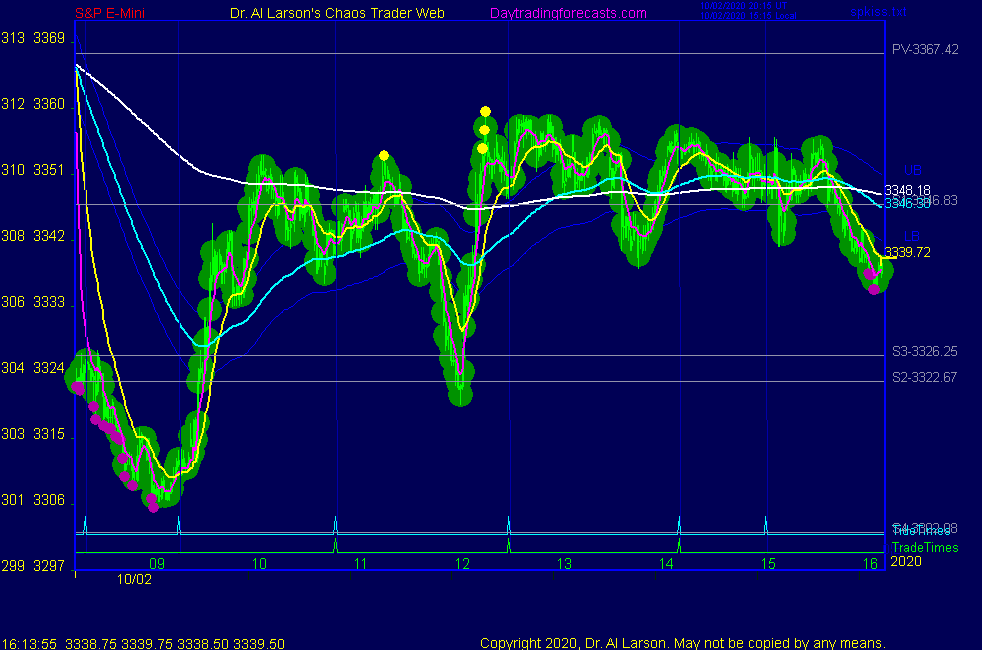
10/2/2020 10:09:49 AM MT Al****:: the third chart on the SPKISS page has bars colored by the 20/110 minute EXMAs. They indicated a sell on first MoonTide trade
but prices bounced off of the S2/S3 pivot prices
10/2/2020 9:28:19 AM MT Al****:: you are welcome sam
10/2/2020 9:25:34 AM MT sam****:: thanks for doing this Al
10/2/2020 9:15:56 AM MT Al****:: I have opened the chat room to everyone so if you have comments or questions speak up
10/2/2020 9:08:26 AM MT Al****:: this is the report from my IB trading system
Finl Instr Buys Sells Net Avg (BOT) Avg (SLD) Total (BOT) Total (SLD) Net Total Comm Net Incl. Comm
MES Dec18'20 @GLOBEX 1 1 0 3,308.25000 3,339.00000 16,541.25 16,695.00 153.75 0.94 152.81
10/2/2020 8:55:56 AM MT Al****:: stopped out for nice gain while I was at breakfast
10/2/2020 8:36:22 AM MT Al****:: putting a sell limit at 3360 and stop at 3339
10/2/2020 8:21:02 AM MT Al****:: now I've put my stop at 3332 below the yellow vibration line on esnat72
10/2/2020 7:51:31 AM MT Al****:: I have placed a Chaos Trading Made Easy chart in the Certified Chaos Trader's Room. That room is open
to graduates of my 4 main courses. See http://moneytide.com -> Courses for details.
That chart, the rally to 11:00 tendency, and the Secret charts helped me buy near 3308.5
I'm sorry I can't call trades like this in real time - they just happen too fast
10/2/2020 7:33:52 AM MT Al****:: on the Secret->esnat72 chart there are 3 vertical lines -prices just ran up the first one
10/2/2020 7:11:32 AM MT Al****:: on the two day 8 hour "spliced" charts this is a gap down
there is a tendency for the market to rally into 11:00 Eastern
10/2/2020 6:45:48 AM MT Al****:: Good Morning visitors. Welcome to the Chaos Clinic.
The written Chaos Clinic is on the AUX page.
This site has a lot of charts,
so you may find it useful to have several of them available within your
browser. If you have a tabbed browser, you can open separate charts
in separate tabs by right clicking on any link, and selecting "open in new tab"
from the menu. The main list of site pages is at
http://daytradingforecasts.com/chartlistsec.asp
Recommended pages to watch are SPKISS, MTRainbow, and Chat.
For astro stuff, add SPSunMoon, Wheel, and Chaos Clinic.
A special set of Dr. Al's research charts are on the Secret page.
Comments in the chat room are announced by a
"duck call" noise. This noise also occurs when the sofware detects a
resonant hex pattern on the Wheel page. MoonTide trading tutorials
are on the right side of the ListOfCharts page. One should
read Trading the MoonTide Tutorial and Keep it Simple as a minimum.
Many subcribers do not strictly trade the MoonTides, but use the charts on this
site as input to their own trading strategies. For example, the bottom chart on the
SPKiss page is good starting point for swing traders.
Also on this site is the Certified Chaos Trader's Room. That room is open
to graduates of my 4 main courses. See http://moneytide.com -> Courses for details.
9:00 Eastern-System: No comments
![]()
![]()