![]()
![]()
********************************************************************************
Zoom Zooms With Astro Power
Chaos Clinic for 9/18/2020
********************************************************************************
While many stocks are being negatively impacted by the pandemic, there is one stock
going up so fast that one cannot ignore it: Zoom, symbol ZM. Almost everyone now knows
about Zoom, thanks to the pandemic forcing remote learning and remote collaboration.
Just as COVID-19 ripped people apart, Zoom reconnected them. Timely.
If that did not get your notice, the huge jump on August 31st should have. In
just 24 hours, ZM jumped from near 330 to 478, a nearly 60% jump.
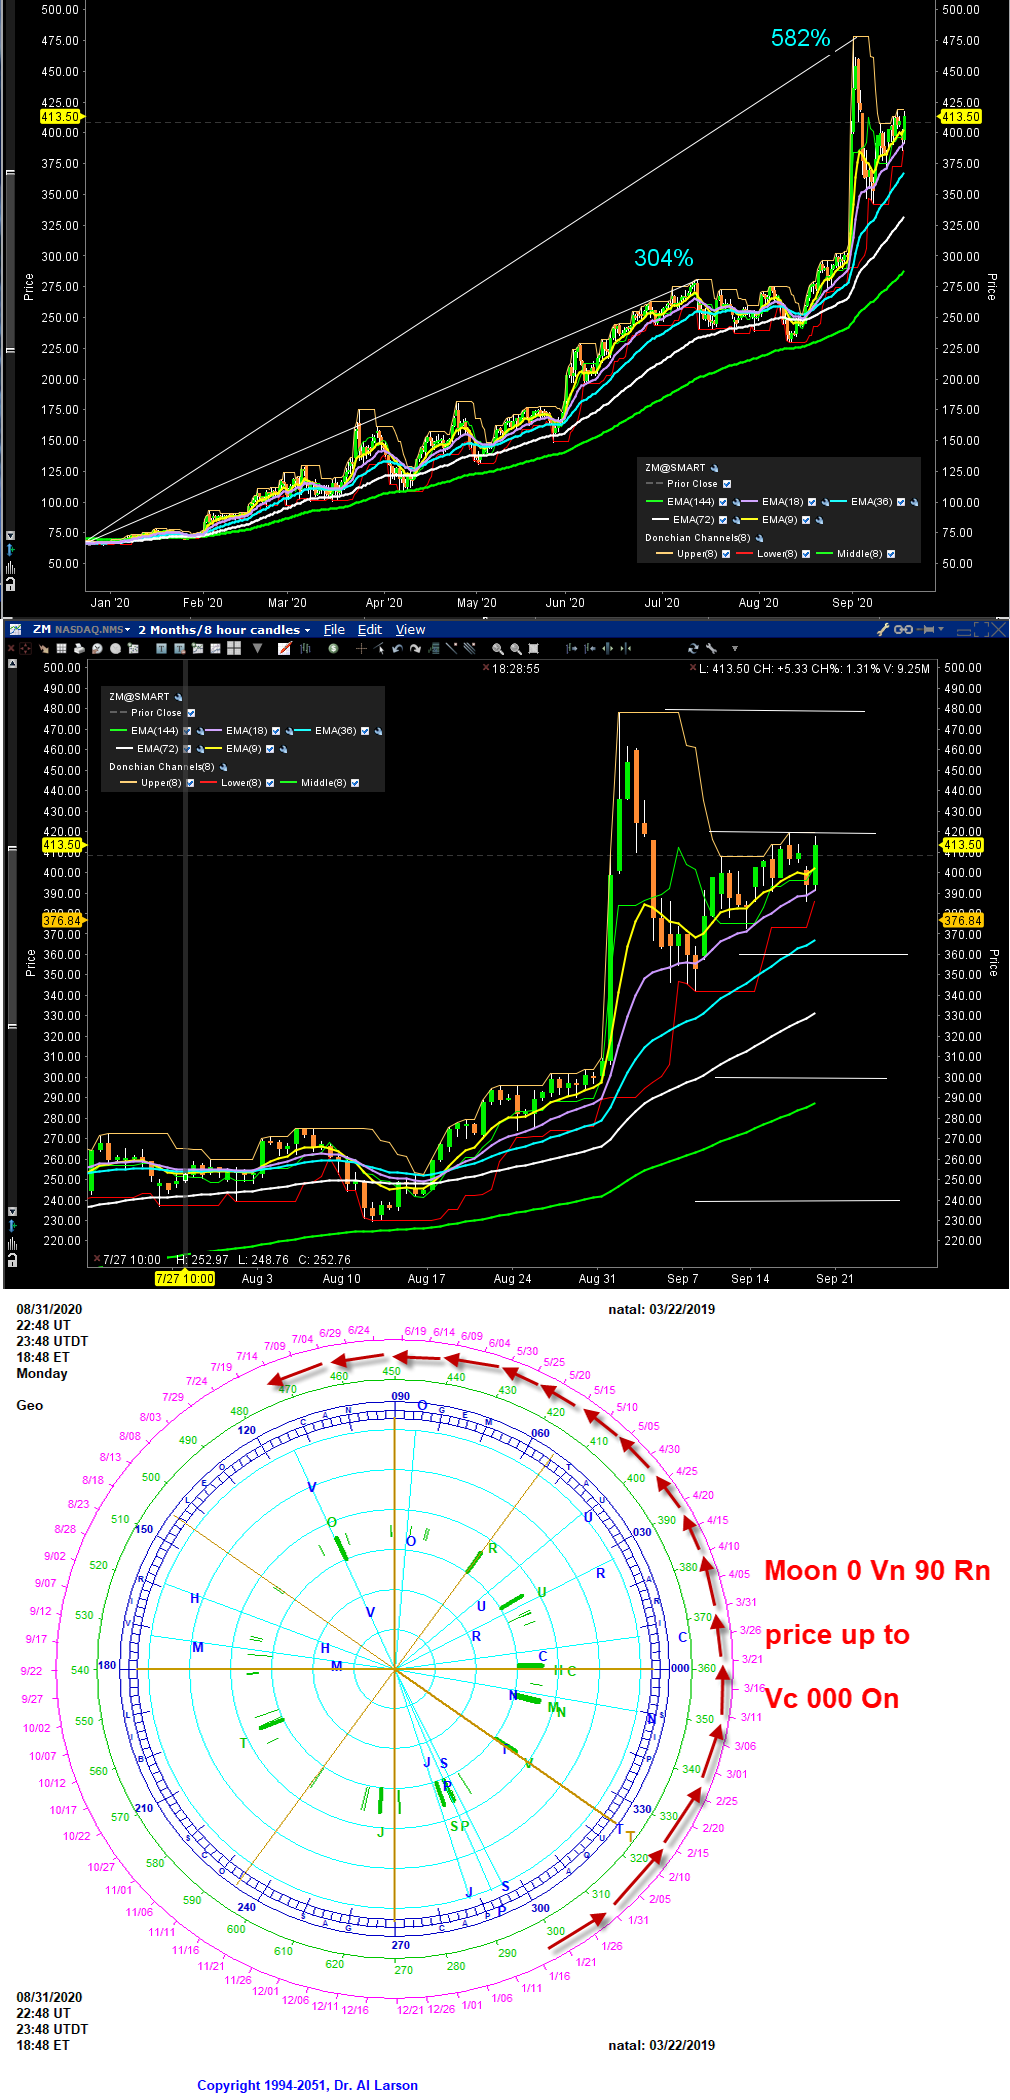
The three charts above show what's happening. At the beginning of 2020, ZM was about
72. Then as the pandemic became a serious problem in February and March, prices
moved up. By mid-July prices had risen over 300 percent. Then the big jump in late
August extended this gain to over 580 percent. This is shown on the top chart.
Clearly there is a lot of money chasing this stock. The second chart is an 8 hour bar
chart with a rainbow of EXMAs. The 144 bar is a 48 day EXMA, the 72 is 24 day,
the 36 is a 12 day, the 18 is the 6 day, and the 9 is the 3 day.
After the big jump, the pullback was only to the 6 day. The slope of that EXMA
remains up, suggesting continued rally.
Another thing to note on this chart are the support and resistance near 240, 300, 360, 420, and 480.
These are all key aspects of the Wheel of 360 running on the 6th harmonic.
This indicates a stock with a very energetic behavior. So a look at its natal
chart is warranted.
The first trade natal date of ZM is 3/22/2019. This was a clever choice, since the spring equinox
is the start of the natural year. On ZM's natal date, the Moon, Venus, Jupiter and Uranus
filled four corners of a hexagon, hence the 6th harmonic behavior. It's the 6th harmonic
that forms snowflakes.
Off that same natal Moon the Node, Uranus, and Saturn/Pluto form a square. That square
provides the capability for ZM to frequency double, because it divides two of the hex
sides in half. This gives ZM the ability to make chaotic moves.
An example of that is the third chart, showing the chaotic move of 8/31/2020. This is
an ephemeris wheel showing current planets as blue lines and natal planets as green bars.
It is my primary tool for studying specific events.
The red arrows show the ZM price move. As the current Moon conjoined natal Venus and squared natal Mars,
prices jumped from natal Saturn/Pluto to natal Node, which was being transited by current Venus.
So that frequency doubling square was highly energized, a clear case of Market Astrophysics
in action. Whoever set the first trade date for ZM knew what they were doing.
So ZM is not only a "right stock at the right time", but one that is built to be a rocket.
Understanding its structure helps evaluate it as an investment. To me, it looks
like a stock to consider buying on dips. The natal hex gives
seasonal energy points near 2/15, 4/11, 6/16, 8/19, and 10/16. Watch these dates
for turns. Use the rainbow of EXMAs to help find the dips, and to set stops.
It may also be useful to get an XGO energy chart for Zoom.
You can order one and learn more about my work at
Moneytide.com
9/18/2020 12:20:23 PM MT Al****:: and that SH chart looks good.
9/18/2020 12:18:26 PM MT Al****:: I'd probably hold if it weren't quad witching day but I have a nice day trade gain and I'm tired. Thanks for coming. See you next week. Take some courses. Stay safe this weekend!
9/18/2020 12:12:26 PM MT Al****:: qq: it was lower - don't want to give it to you here
9/18/2020 12:11:20 PM MT Al****:: OK, taking +41 and calling it a day
9/18/2020 12:07:11 PM MT qq:: Looking back I think you said around 3319
9/18/2020 12:04:24 PM MT Al****:: here it would be perfectly fine to take profits or hold for more
I'll hold for now
9/18/2020 12:04:08 PM MT qq:: Al, was 3219 the target the other day?
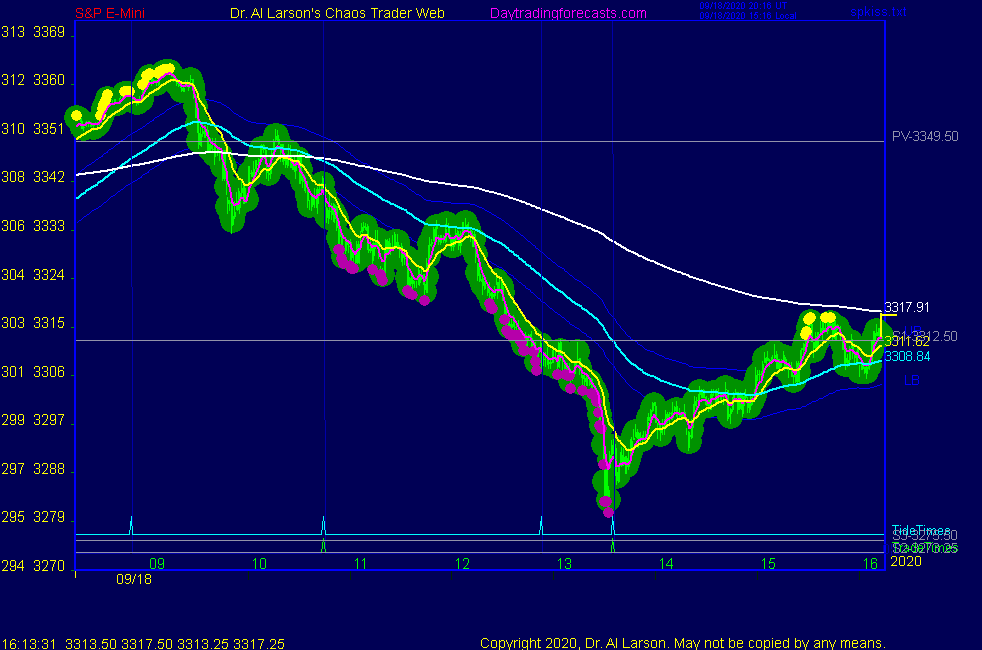
9/18/2020 11:56:24 AM MT Al****:: the EXMAs looks like move 6 of 7 in a down Chaos Clamshell
9/18/2020 11:38:35 AM MT Al****:: here one could use esnat72 to lower the stop to 3307
9/18/2020 11:32:16 AM MT Al****:: the energy for this vertical drop is coming from the rotating Exchange opposing natal Moon
9/18/2020 11:30:11 AM MT Al****:: this is a falling dagger. Do not buy it.
9/18/2020 11:24:59 AM MT Al****:: one can also use esnat72 as a stop guide. High was a green vibration. Broke below another green, so a 3318 stop is good.
Also, reaching another green may be a cover point
9/18/2020 11:18:15 AM MT Al****:: nearing the next trade time one has to decide to cover or carry through. Today the flow of the EXMAs suggests carry, so lower stop to 3319
9/18/2020 10:56:47 AM MT Al****:: that's above yesterdays low, which were support that has now become resistance
9/18/2020 10:55:23 AM MT Al****:: note how the slope of the EXMAs has steepened-this lets one puch the stop down to about 3324 near the 110 minute EXMA
9/18/2020 10:44:39 AM MT Al****:: the pivot prices are posted on the SP1Day page and show up on
some charts
many Flash Boy computers use these. Everyone should read the book by that title.
broke S1, so going lower
9/18/2020 10:44:37 AM MT qq:: Al, I see it reaching your target.
9/18/2020 10:39:49 AM MT Al****:: broke yesterday's low
9/18/2020 10:23:02 AM MT Al****:: qq: that longer term target I gave you earlier this week is looking good
9/18/2020 10:20:12 AM MT Al****:: this movement would allow moving a stop down to 3336
9/18/2020 10:15:54 AM MT Al****:: here the 110 turned prices down
on esnat72 the yellow vibration level, which was early support
is now resistance
9/18/2020 10:11:33 AM MT qq:: I'm seeing several positive divergencies such as Negative VIX, Russell moving up and other
9/18/2020 10:06:05 AM MT qq:: I'm guessing one more brief dip before next window.
9/18/2020 10:05:19 AM MT Al****:: you are welcome as always
9/18/2020 10:04:22 AM MT qq:: Thanks Al for your insight.
9/18/2020 10:02:33 AM MT Al****:: one needs to be very nimble to day trade the S&P
I like to do longer term trading using 8 hour bar charts
if one is bearish one might want to look at the SH exchange traded fund with a rainbow of EXMAs as per the ZM clinic example
9/18/2020 9:56:08 AM MT Al****:: the bounce stopped at the 110 minute EXMA, so using the 220 as a stop guide is working
9/18/2020 9:55:04 AM MT Al****:: fast bounce up to the yellow vibration level on esnat72
9/18/2020 9:45:14 AM MT Al****:: yesterday had 3 bottoms. the Flash Boys sold the pivot at 3349.5
S1 is just below those 3 bottoms at 3312.5, so I think they will
be broken
9/18/2020 9:41:40 AM MT Al****:: note the divergence of the 440, 220, and 110 EXMAs on the MTRainbow chart and the 3rd SPKISS chart
one can use them as a stop guide. Here the grey 220 suggests a stop
of 3340. That would lock in a gain of 5
9/18/2020 9:33:20 AM MT Al****:: you are welcome
9/18/2020 9:31:21 AM MT vic****:: Al, thanks for enabling chat again
9/18/2020 8:54:30 AM MT Al****:: the third chart on the SPKISS page gave a MoonTide continuation sell near 3345 - this is the type of chart you need to set up
9/18/2020 8:15:32 AM MT Al****:: taking a break for breakfast
9/18/2020 8:10:26 AM MT Al****:: note how prices bounced off the yellow level on Secret->esnat72.
These fast moves are the Flash Boy computers at work. It amazes me how they find the natural price vibration levels
9/18/2020 7:55:00 AM MT Al****:: I have placed a Fractal of Pi chart in the Certified Chaos Trader's Room. That room is open
to graduates of my 4 main courses. See http://moneytide.com -> Courses for details.
9/18/2020 7:49:40 AM MT Al****:: one could have sold the break below the white level on esnat72
I didn't since I am short from Wednesday afternoon on a position trade.
9/18/2020 7:34:35 AM MT Al****:: the overnight rally was a setup. The normal session brings the volume.
9/18/2020 7:28:46 AM MT Al****:: today is quad witching day, when four different option months expire. These days can be dull and choppy.
on Secret ->esnat72 there is an overnight rally from the yellow to the green vibration levels. It has the shape of an up Chaos Clamshell. Big players can move the market overnight in their dark pools on low volume. So I'm always wary of such moves.
The move best fits the red -Tide on the SPKISS page.
9/18/2020 6:38:23 AM MT Al****:: Good Morning visitors. Welcome to the Chaos Clinic.
The written Chaos Clinic is on the AUX page.
This site has a lot of charts,
so you may find it useful to have several of them available within your
browser. If you have a tabbed browser, you can open separate charts
in separate tabs by right clicking on any link, and selecting "open in new tab"
from the menu. The main list of site pages is at
http://daytradingforecasts.com/chartlistsec.asp
Recommended pages to watch are SPKISS, MTRainbow, and Chat.
For astro stuff, add SPSunMoon, Wheel, and Chaos Clinic.
A special set of Dr. Al's research charts are on the Secret page.
Comments in the chat room are announced by a
"duck call" noise. This noise also occurs when the sofware detects a
resonant hex pattern on the Wheel page. MoonTide trading tutorials
are on the right side of the ListOfCharts page. One should
read Trading the MoonTide Tutorial and Keep it Simple as a minimum.
Many subcribers do not strictly trade the MoonTides, but use the charts on this
site as input to their own trading strategies. For example, the bottom chart on the
SPKiss page is good starting point for swing traders.
Also on this site is the Certified Chaos Trader's Room. That room is open
to graduates of my 4 main courses. See http://moneytide.com -> Courses for details.
![]()
![]()