![]()
![]()
********************************************************************************
The Full Moon and Mercury Top The S&P
Chaos Clinic for 9/4/2020
written 9/3/2020
********************************************************************************
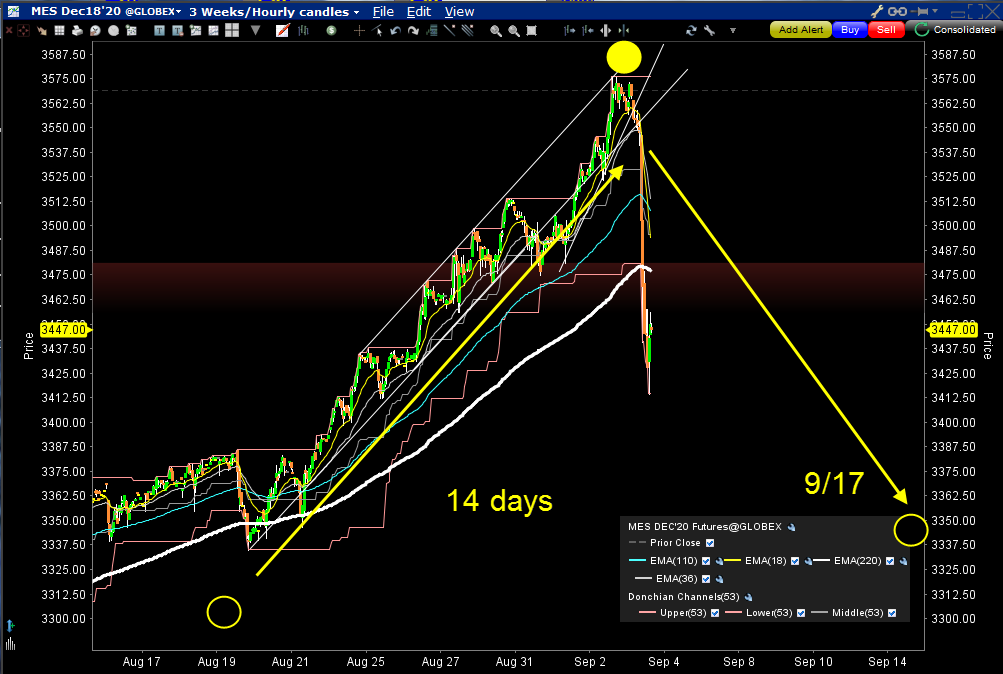
In the last two weeks, the S&P 500 rallied sharply. Then today (Thursday September 3rd)
it dropped sharply, after rallying sharply yesterday. This chart shows what happened.
The rally was basically from the late August New Moon, to this week's Full Moon. The
rally 14 days, half a Moon cycle. The last portion rallied very sharply, in a move that
took 45 hours ( one eighth of a 360 hour circle = 15 days. ) This was clearly a
blow off type move.
Then today the bottom fell out. This sharp drop was in part caused by a synchronization
of the Full/New Moon cycle with the Moon-Mercury cycle of 40 days. This cycle is recorded
many times in the Bible - Christ in the desert, Noah's flood, Moses on the Mountain, etc.
The cycle is mentioned in over 100 bible verses. It shows up in wheat prices as far back as
Babylonian times.
When cycles synchronize, they form another cycle known as a beat cycle. The 40 day Mercury-Moon
cycle and the 29.5 day Full Moon cycle form a 112.38 day beat cycle. This turns out to be almost
exactly one half a 224.70 day Venus cycle and nearly equal to the 115.87 day Mercury-Earth cycle.
So right now, the planetary energy cycle is ringing like a bell, forming a resonant energy peak.
Physically, the Full Moon reflects negative ions from the solar wind back into our atmosphere,
making humans feel giddy and romantic. The New Moon moves between the Sun and the Earth,
trapping those ions, making humans feel down. That's why since ancient times, armies have
attacked their enemies at New Moon, when they were emotionally down, after whipping their own
warriors into a frenzy to overcome the negative effect.
Just based on the Moon cycle, prices may well decline into the next New Moon September 17th.
The chart shows a Rainbow of EXMAs. The numbers 18, 110, and 220 come from the EXMAs
used on daytradingforecasts.com where the values are in minutes. Here the values
are in hours. Today's drop broke vertically down through the 220 hour EXMA, turning it sharply down.
A vertical drop through an EXMA usually signals a significant change in trend that will be down for
at least the length of the EXMA, in this case, about 9 days.
So it could well be that the S&P has ended its COVID-19 "recovery bounce." As the election race heats up,
it adds uncertainty to an already uncertain situation. The markets do not like uncertainty. The 60 days
until the election are 1.5 the Mercury Moon cycles. The longer cycles mentioned above could extend the decline.
For more on my work see
Moneytide.com
9/4/2020 1:02:48 PM MT qq:: You're welcome BOG
9/4/2020 12:30:36 PM MT BOG****:: Thanks @qq
9/4/2020 9:57:43 AM MT qq:: Recently I refined the planetary pictures projection using Titanium Market Trader. It's showing a rebound into day after labor day. Then Wednesday after through Friday down. The follow week also is projected as down with the following week rebounding. Time will tell.
9/4/2020 9:35:15 AM MT Al****:: the drop ended at the 8/19 low, so rest of day may be flat to modest up. Longer term, bearish. But a nice gain today on one trade is fine. So I think I'll call it a day. Thanks for coming. Have a great weekend. Take some courses. See you nest week
9/4/2020 9:12:46 AM MT Al****:: the third chart on the SPKISS page EXMAs showed the sell set up
the yellow and magenta "push balls" on the 4th chart showed the end of trying to push higher (yellow) and trying to push lower (magenta)
9/4/2020 9:03:19 AM MT Al****:: drop was on red -Tide; one could have taken a day trade going into the Tide time. I had a Sep contract swing trade on from yesterday which I covered on the bounce.
9/4/2020 8:57:21 AM MT Al****:: note Secret ->esnat72 prices moved 3 white vibration levels
9/4/2020 8:29:10 AM MT Al****:: red -Tide started it down as well
treating the two day 24 hour pattern as and ABCD and using
CD=AB projects 3322
9/4/2020 8:00:44 AM MT Al****:: energy for drop came from rotating exchange passing Venus, part of the resonance
9/4/2020 7:34:22 AM MT qq:: Looks like bear flag.
9/4/2020 6:20:23 AM MT Al****:: Good Morning visitors. Welcome to the Chaos Clinic.
The written Chaos Clinic is on the AUX page.
This site has a lot of charts,
so you may find it useful to have several of them available within your
browser. If you have a tabbed browser, you can open separate charts
in separate tabs by right clicking on any link, and selecting "open in new tab"
from the menu. The main list of site pages is at
http://daytradingforecasts.com/chartlistsec.asp
Recommended pages to watch are SPKISS, MTRainbow, and Chat.
For astro stuff, add SPSunMoon, Wheel, and Chaos Clinic.
A special set of Dr. Al's research charts are on the Secret page.
Comments in the chat room are announced by a
"duck call" noise. This noise also occurs when the sofware detects a
resonant hex pattern on the Wheel page. MoonTide trading tutorials
are on the right side of the ListOfCharts page. One should
read Trading the MoonTide Tutorial and Keep it Simple as a minimum.
Many subcribers do not strictly trade the MoonTides, but use the charts on this
site as input to their own trading strategies. For example, the bottom chart on the
SPKiss page is good starting point for swing traders.
Also on this site is the Certified Chaos Trader's Room. That room is open
to graduates of my 4 main courses. See http://moneytide.com -> Courses for details.
9:00 Eastern-System: No comments
![]()
![]()