
3:13 just in time :) ; done; thanks for coming; see you next week; take some courses
3:11 no juice, aborted for +.25
3:07 long from 65.5 stop 63.5 holding
3:04 looking good, 220 EXMA is curling up now
3:01 Face of God pattern helped me find the energy center. Prices were attracted to it, now being repelled by it.
2:58 the 110 minute EXMA turned up; now trying to turn the 220 up
2:52 Face of God pattern looking good, like the look of the EXMAs
2:50 After 3:10 we may get a short squeeze
2:46 not much juice -yet
2:41 trade was both sides of 110 EXMA, but now is staying above it; favorable
2:39 updated my Face of God chart in the CCT Room
2:37 looking good-stop to 63.5; risk 2
2:31 pressing a bit; bought 2065.5 stop 2062; Moon +T180 flux is rising near 2062
2:27 still looks like it could rally; after 2:30 often get a "Settle the books" move by big traders
2:25 stuck flat
2:22 not getting it
2:17 looking for some up juice
2:09 right at third trade time; looking for a buy setup
2:06 trading at same price as at 11:20 so not really going far
1:57 that was move 1 in an up fractal; now will wait to buy at end of move 2
1:56 aborted for +.25 - not going
1:47 stop to 2063-risk 2
1:44 updated my Face Of God chart in the CCT Room
1:39 bought 2065 stop 2061 for now ; down fractal is over so pressing EXMA type entry
1:36 in the window for the 14:09 trade time, so looking for a buy entry
1:33 should not have let myself get sucked in by that vacuum cleaner :)
1:31 OK, dodged a bullet there
1:30 aborting for 0; just feels bad
1:28 stop now to 2065.5, just above the 110
1:25 trade has stayed under the 110 minute EXMA; it's slope is now increasing
1:18 OK, sold 2063.5 stop 2066.5 - looks like tracking red -Tide
1:15 still watching
1:10 from the high the pattern looks like a vacuum cleaner
1:06 experimental autotrader aborted the long and sold-manually I'm waiting
1:02 I have place my Fractal of Pi chart in the CCT Room
12:55 my Fractal of Pi overlay is warning that bottom formation may take another 40 minutes;
this is where I expect the autotrader to have problems
12:53 watching for a 20/110 buy signal
12:51 my experimental autotrader just bought coming into trade time
12:44 have a double bottom-will it hold?
12:39 early traded red -Tide, now green +Tide
12:37 I'm not trading a move 7, I'll wait until the down fractal completes
12:31 looks like the Flash Boys sold the S1 level near 2067-this would be move 7 down
12:25 on the Aux page I'm showing a research chart - work on an autotrader to trade the XTide swings
12:22 from the high we now are in a possible move 7 in a down Chaos Clamshell
11:42 may be bottoming - hit my earlier 2064.5 target which is based on physics
11:36 I'm sorry to have missed this move, but there are always more moves coming
11:20 back-see I missed a continuation sell-happens when I go up to say good morning to my wife-much more important than money
10:57 taking a break- looks like chop for a while
10:49 passing the exact Tide Time
10:40 in hindsight my entry was late; should have been up near 2072
10:37 stopped for -2; good trade because I controlled my risk. IF you always control your risk, you can survive and thrive
10:30 stop to 2071.5, risk 2
10:28 placing a cover limit buy order at 2064.5
10:25 breaking 2070, taking the continuation sell; sold 2069.5 stop 2072.5; looks like red -Tide
10:20 that pattern suggests sideways until after noon
10:18 I have placed a Face of God chart in the Certified Chaos Trader's Room. That room is open
to graduates of my 4 main courses. See http://moneytide.com -> Courses for details.
eMylar Fractal of Pi overlays help you be patient, since they show you future potential moves.
The best bargain in my courses is to take the Cash In On Chaos and Fractal of Pi courses and
learn to use the FOP overlay. Then take Chaos Trading Made Easy, and finish with Face Of God.
10:12 on the MTRainbow chart, the flow is down but has slowed; the first trade may be a pass
10:05 in a flat market, the XTide forecast gives a pretty good idea of the minor swings; it is at
the bottom of the Chaos Clinic chart; the magenta line. IT is also on the CTME chart, which those who
have taken the Chaos Trading Made Easy course can see
9:52 on 24 hour chart, you can draw an ellipse around the congestion
I've posted one on the AUX page. This is what I call a Fireball. It suggests flat to up.
9:42 congesting sideways from yesterday-range about 2070 to 2082; 12 points is one side of hexagon on Wheel of 72
9:29 today's trades are 10:48, 13:06, and 14:09; so we start by just watching
9:00 Good Morning. Welcome to the Chaos Clinic. This site has a lot of charts,
so you may find it useful to have several of them available within your
browser. If you have a tabbed browser, you can open separate charts
in separate tabs by right clicking on any link, and selecting "open in new tab"
from the menu. The main list of site pages is at
http://daytradingforecasts.com/chartlistsec.asp
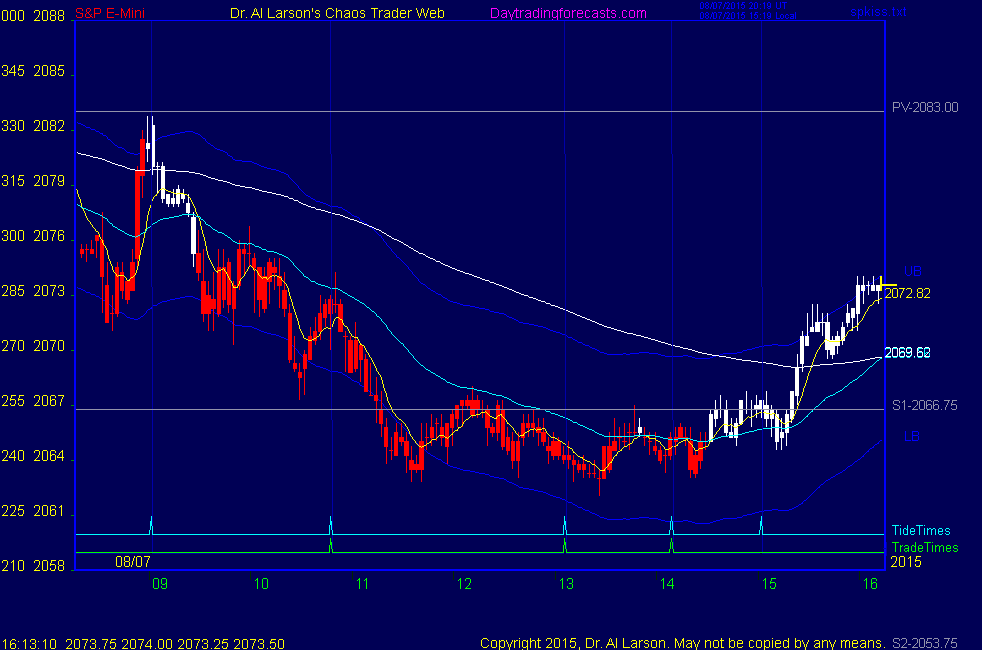
Recommended pages to watch are SPKISS, MTRainbow, and Chat.
For astro stuff, add SPSunMoonMer, Wheel, and Chaos Clinic.
Chaos clinic comments appear at the bottom of the SPKISS, MTRainbow,
and ChaosClinic pages. Comments in the chat room are announced by a
"duck call" noise. This noise also occurs when the sofware detects a
resonant hex pattern on the Wheel page. Trading tutorials
are on the right side of the ListOfCharts page. One should
read Trading the MoonTide Tutorial and Keep it Simple as a minimum.
9:00 Eastern-System: No comments
![]()
![]()