
Chaos Clinic Recap
Here are Al's comments
3:32 Done for the day-thanks for coming-see you in 2 weeks-going camping next Friday. Take a Course.
3:29 out for +2.25
3:22 stop to 1011
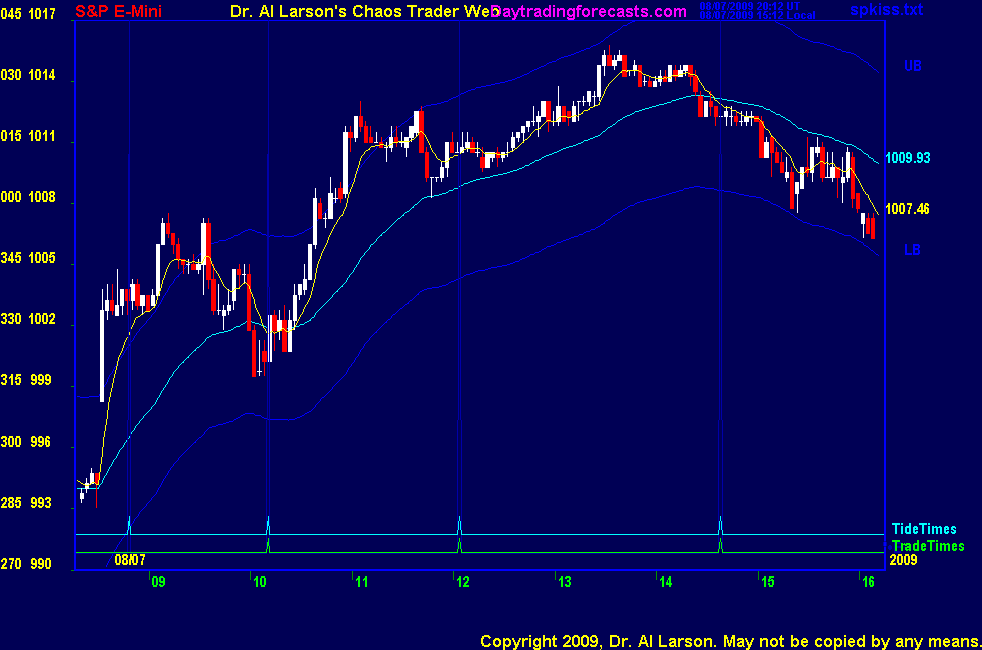
3:18 the actractor is probaly Moon conjoin Mercury at 1003.5
3:13 stop to 1012.5
3:08 coming to the Mars and Saturn timelines - Mars is squaring Saturn
3:03 stop to 1013; moving better now
3:02 stop to 1014; OK but slow
2:52 stop to 1015
2:50 looking OK
2:44 Stop to 1016
2:33 I like that it turned down on the Moon timeline
2:27 elected short 1012.75, putting stop at 1016.75
2:15 in the trade window; upside looks limited; breadkdown possible; placing sell stop at 1012.75
2:08 still holding up but not moving much. Possible late drop.
1:40 We now have a rising wedge pattern with the apex of the wedge near the nest trade time. Added chart to CCT Room
1:33 I flinched on my trade, and can now see I could have gotten more. But one cannot second guess oneself.
Past is Past. Look Ahead!
1:29 now high, but pace is moderate
1:21 the 110 EXMA slope is up, suggesting now tracking the green +Tide
1:11 near the next trade time we come to the Mercury 0 and Moon T180 timelines-could end a 6 hour up move
1:07 so far this is a typical Friday "pop up and distribrute" day
1:02 little streak up the Sun timeline, marginal new high
12:51 hex resonance hold prices stable-triple top now on Mercury+225 flux
12:48 not much juice; aborting for +.5
12:45 stop to 1009
12:37 taking this as a continuation buy at 1011, stop 1008
12:30 Chaotic systems , which includes markets, have more than one "solution." They do produce very usable fractal patterns,
but sometimes they produce more than one. My second FOP suggests prices hold up to the close.
12:24 posted a second Fractal of Pi in the CCT Room
12:19 turned dull-not doing anything except watching
12:08 fixed some typos in the times of comments; at the second trade time; rally stalling, looks like going flat
11:53 such SA/SR's have physical causes; today the Moon is opposing Mercury; On the Aux page I have posted a chart
showing only the Sun, Moon, and Mercury flux and timelines; it shows Moon/Mercury set the SA/SR
11:46 top of the move made a half circle pattern- a little "fireball" chaos theory Strange Attractor/Repellor
11:43 on the SP1Day page are listed the "pivot prices" used by many pit traders - top near 1012.43 = resist2
11:40 coming into second trade time-Looks to me like the rally is stalling; 110 EXMA is at 1008
11:37 hex recognizer found another resonant hex formed by price, Mars, Sun, and Moon B vector
11:25 in the chat room cgm mentioned 1010 is a cardinal value on Gann's square of 9
it is also a 3/8 retracement of the big decline
11:18 on the MTRainbow chart the 440 EXMA is up-this is what told me not to sell the early drop
selling early worked the past two days, but not today
11:06 my Fractal of Pi warned me of that rally-posting updated copy in CCT Room
10:59 break to new highs attracted some buying-I have no regrets taking 5- past is past, look aheed
10:44 hex pattern recognized on the Wheel of Fortune-see Hex Wheels today on List of Charts page
the resonance action caused the pop up to 1008
10:40 covered because I expected resistance at the triple top
10:37 covering for +5
10:36 stop to 1003
10:32 stop to 1002, break even
10:31 stop to 1000
10:23 stop to 999; following red -Tide
10:20 110 has turned up; fractal says holdup until after 12:00; rebought 1002, stop 998
10:13 posted a Fractal of Pi chart in the Certified Chaos Trader's Room-open to graduates of my 4 main courses
10:09 got 20/110 sell crossing-not an automatic entry-could be a head fake, so watfh the follow through
10:04 not much potential below with 440 EXMA at 998.3 and rising
10:01 out -4; no follow through going up
9:57 rally may be limited to the early high; willing to accept small gain
9:54 support held on 110 EXMA and 20 EXMA turned up in continuation buy; bought 1005 stop 1001
9:47 looks to me like we hold up and distribute, with Moon setting low of distribution range
9:44 on MTRainbow chart the white 440 EXMA is at about 998, so it would provide support
9:43 watching for possible sell- need 20 EXMA to cross 110
9:39 support on the moon T+000 flux; 110 EXMA has risen to be just under it
9:36 trade times today are 10:11 12:04 14:38
9:31 on the Chaos Clinic Chart, news rally went up the Mercury(M) timeline, peaked on Mars(R) timeline
Uranus electric field flux set price high, then settled on Mars/Saturn flux
9:16 up early on jobs report, making 3 day triple top
9:00 Good morning from Chaos Manor
Besides the comments made by Al, the chat room is has live
comments from other traders who sometimes share their views,
trades and tips. Below are the chat room comments from this clinic
8/7/2009 12:56:51 PM MT wmp:: Thanks!
8/7/2009 12:54:40 PM MT cgm:: provided 13.75 holds
8/7/2009 12:54:32 PM MT Al****:: yes, read the Tutorials on this site-Trading the MoonTides. and Keep- It simple
right side of the list of charts page
8/7/2009 12:53:13 PM MT cgm:: projected close 999.5
8/7/2009 12:48:41 PM MT wmp:: ok...just checking. I'm more of an intra-day trader than end-of-day trader. But I do both. I just subscribed to your daily email service. What's the best way to get up to speed on how to intra-day trade the S&P with the information in the emails? Is there anything specific I should begin reading?
8/7/2009 12:43:10 PM MT Al****:: either
8/7/2009 12:35:28 PM MT wmp:: are the indicators that come with the course end-of-day or intra-day indicators?
8/7/2009 12:27:02 PM MT Al****:: If you do it first, I'd check getting a trila to Wave59 to do the homework using the indicators. Or get the $300 per year eSignal End of Day program. It works outside trading hours.
The inidcators are explainded, so if Ninja Trader lets you program your own inidcators, you could add them to Ninja Trader.
8/7/2009 12:14:18 PM MT wmp:: thanks for your advice. I like the looks of the Chaos Trading Made Easy as a starter course. I use Ninja trader so, I guess the indicators won't work with it. As long as you think it is ok, i'll start with that one and then move to the other courses.
8/7/2009 12:02:33 PM MT Al****:: Chaos Tradeing Made Easy is the lightest on theory and most "top down". It is good if you have a lot of experience using a standard trading program, because it gives you indicators that help you determing when the market is normal, or is going chaotic. Best used with eSignal, Wave59, or TradeStation
That's one alternative. The other is to take the Cash In On Chaos and Fractal of Pi courses to get access to the FOP pattern.
Works with any charting program.
8/7/2009 11:53:29 AM MT wmp:: ok...thanks. This is my first day at your site. I am interested in taking an entry level course. what course do you recommend that i start with the Chaos Trading Made Easy Online Course or something else?
8/7/2009 11:49:07 AM MT Al****:: the CCT room is the Certified Chaos Trader's Room. It is open to those who have taken my four main courses described at http://moneytide.com -> Courses.
8/7/2009 11:45:18 AM MT wmp:: Hello...i'm new to the site. What is the CCT room and how do I access to see the charts?
8/7/2009 11:19:38 AM MT cgm:: next important spot is the135 degree august # 1026
8/7/2009 9:22:48 AM MT Ahab****:: Al...nice call on fractal of pi...puts sharp move in context..
8/7/2009 9:19:51 AM MT Ahab****:: cgm...I assume you are saying that we are at a reversal point.Based upon the square of 9 where do you see prices going from here?
8/7/2009 8:56:14 AM MT cgm:: 1010 is june 22 cardinal on gann sq of 9 chart
8/7/2009 7:15:58 AM MT Al****:: GM all-good luck today
8/7/2009 5:57:38 AM MT mm****:: gm all - have a great day
9:00 Eastern-System: No comments


[ Live Clinics on Friday on DaytradingForecasts.com ]