![]()
![]()
********************************************************************************
The Devil Made Me Do It
Chaos Clinic for 7/23/2021
********************************************************************************
Comedian Flip Wilson invented the catch phrase "The Devil Made Me Do It" in the 1970's.
Now it's a common theme is movies. But there is a deeper insight.
Ancient astrologer/priests called the planet Mercury Satan, because is was so very hard to see,
This is because it is so close to the Sun, that it could only be see just before sunrise on
those days when it rose just before the Sun. Ancient Egyptians followed the planets through
the day time sky, then watched them disappear below the horizon into the "netherworld."
When they rose in the morning the were returning from the netherwold(Hell). So the
one that they could only see with much difficulty was the Devil. In the bible,
Mercury cycles are often coded as the Devil.
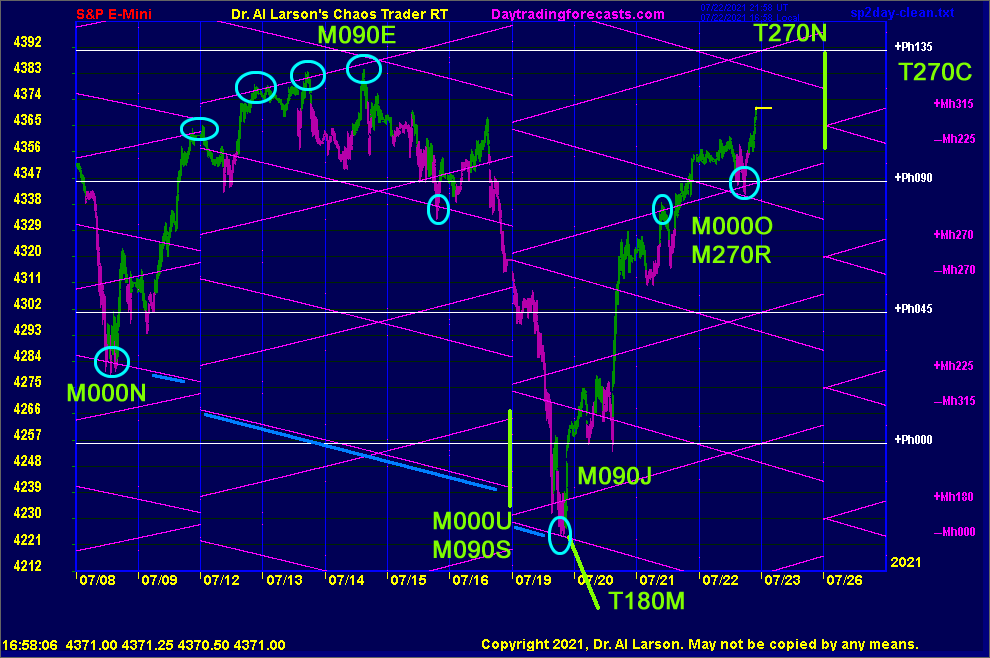
This chart shows the last two weeks of the S&P eMini Futures. Plotted on the chart are the
heliocentric electric field flux lines for Mercury. These can serve as support and
resistance levels. Several are circled.
Also noted on the chart are aspects of Mercury with other helio planets.
On July 8th, Mercury conjoin Neptune (M000N) at 342 degrees was a low.
Six calendar days later, on the 14th, Mercury at 22 degrees squared the Earth (M090E).
In the prior two days, the up Mercury flux line resistance formed a "Three drives to a top."
From there, the eMini began its plunge.
Over the weekend, on the 18th,Mercury conjoined Uranus at 42 degrees,
The Moon opposed this helio conjunction.
Mercury was also squaring Saturn (M090S).
Watching the Moon on a helio chart may seem odd,
but in my model of Market Astrophysics, the planets circling the Sun stir up the blob
of gas, causing particles to be ejected into the solar wind. As these reach Earth,
they are focused by the Moon. Because it is so close to the Sun, Mercury accounts for
about 40 per cent of the stirring force on the Sun.
The plunge continued into Monday the 19th, The bottom came late in the day, on the same down
Mercury flux line as the low on the 8th. At that time, the Moon opposed Mercury.
From there the rebound was on. On the 20th, Mercury square Jupiter (the bull) On the 22nd,
Mercury conjoined the Node (M000O) and squared Mars (M270R). This coming weekend,
Mercury squares Neptune (M270N). Next Tuesday Mercury squares Chiron (M270C).
So if one were to as the S&P why it made it's wild plunge and rally, it might say
"The devil made me do it."
For more on my work and to subscribe to Tomorrow's Market Email Hotline and access to daytradingforecasts.com see
Moneytide.com
Software to plot electric field flux lines in NinjaTrader is available at
energyfieldtrading.com
7/23/2021 2:02:13 PM MT TG****:: ... but my guess is a large % of programmers are using the 5 PM EST close and others are using the 4 PM settlement/ daily bar method as defined by Esignal.
7/23/2021 2:01:55 PM MT Al****:: OK, thanks. I'm calling it a day. Thanks for coming. See you next week. Take some courses.
7/23/2021 1:58:48 PM MT TG****:: Here were the R1 levels based on the settlement, a 4:15 PM EST close, and a 5 PM EST close, respectively: 4373.5, 4377.75, and 4381.25. Then go back and look at how price was range bound between the Settlement R1 and the 5PM R1. Now I'm sure that there may be some other day where the settlement and 5 PM EST close are two points apart and the 4:15 PM EST closing price splits the difference and when the pivot is tested the 4:15 PM closing price will look like the best one to still use.
7/23/2021 1:52:17 PM MT TG****:: It's a pain to have two sets of levels to look at it. Most of the time, there is a tendency for the 5 PM EST close to move back towards the settlement price that's calculated as the volume weighted average of the last 30 seconds leading up to the 4 PM EST cash close.
7/23/2021 1:51:23 PM MT Al****:: TG: in Esignal, what time would a Cover On Close order execute?
7/23/2021 1:42:10 PM MT Al****:: I can ask IB to do the same thing but need to do it in a program
7/23/2021 1:40:27 PM MT Al****:: late rally as i expected-early low on esnat72 on yellow, this one on green, 30 point apart - a double is pssible
7/23/2021 1:37:00 PM MT TG****:: I track it for Gold and even though there is still technically a 1:30 settlement the 5 PM EST futures close seems to work well. The way Esignal works is it gives you the choice of a "daily bar" calculation or any close time you enter whether that be 4:00 EST, 4:15 EST or 5:00 EST for the ES.
7/23/2021 1:30:05 PM MT Al****:: dip down to green vibe/+Mh000
7/23/2021 1:21:02 PM MT Al****:: TG, yeah as soon as we get things working really well, the big guys change the rules. I'm still using the 4:15 24 hour number.
The esnat72 levels help.
7/23/2021 1:19:23 PM MT TG****:: For instance, this morning from 6 AM EST to 10 AM EST, the upper limit was R1 based on yesterday's 5 PM EST close. The lower limit was R1 based on yesterday 4 PM EST settlement price. How odd. But yesterday was an extreme case.
7/23/2021 1:16:54 PM MT TG****:: AL, since Esignal makes graphically viewing the Pivot and the other support/resistance levels very easy, I track it based on the settlement price near the 4 PM EST cash close and also now based on the 5 PM EST futures close. The different levels, potentially much further apart, due to the potential for quite different closes both seem to have validity.
7/23/2021 1:09:23 PM MT TG****:: AL, to your point on the end of day close. There is also the 3:45 PM EST "reveal" available to big firms that gives the $ size of the "market on close order" for the NYSE.
7/23/2021 12:20:26 PM MT DWY:: monday's event was a pwoerful event. Not for the downside but the UPSIDE. Much energy was added when LOTS of energy was present.
7/23/2021 12:04:22 PM MT DWY:: Another month after i said no reason at all to sell this market. What is the definition of "main top"? CITs are all about timeframes
7/23/2021 11:46:37 AM MT lik:: Stocks close at 16:00 et, today left 2:15 min, if am not wrong
7/23/2021 11:33:29 AM MT Al****:: there is a new dynamic in trading the S&P futures. Recently the
end of day rules were changed. It was that stocks closed at 14:00 Eastern, and futures at 14:15. Then futures re-opend at 14:30 for a 30 minute settlement period. Normally not much happened then.
Recently the 15 minute futures close was eliminated. So now they just keep trading until 15:00 Eastern. Yesterday there was a sizable move between 14:00 and 15:00.
7/23/2021 11:09:21 AM MT Al****:: note on the AUX chart the dips to the Pluto flux on the 20th and 22nd 2 levels apart. up 2 more would be 4433
7/23/2021 11:04:05 AM MT Al****:: Pluto being in that noon time cluster makes me wonder if we reach the next Ph flux up at 4433. I've done a couple of Chaos Clinics about Ph levels
7/23/2021 10:49:40 AM MT Al****:: the low near 10:00 Easter was on a Natural Time. It's corresponding one is at 16:00, so will probably run until then
7/23/2021 10:24:12 AM MT Al****:: congesting a bit on R3/green vibe/+Mh000 as pass Mercury, Moon, Pluto, and Sun timelines
Rainbow of EXMAs is up
7/23/2021 9:58:58 AM MT Al****:: this is a rocket-I don't sell rockets
I don't know when the next main top is
this low was 28 calendar days since last, so maybe 14 days up from last Monday
7/23/2021 9:33:50 AM MT pog:: Because the market is obviously super strong on a day like to day would you consider a short trade at all.
7/23/2021 9:31:58 AM MT pog:: When is the next main top Al
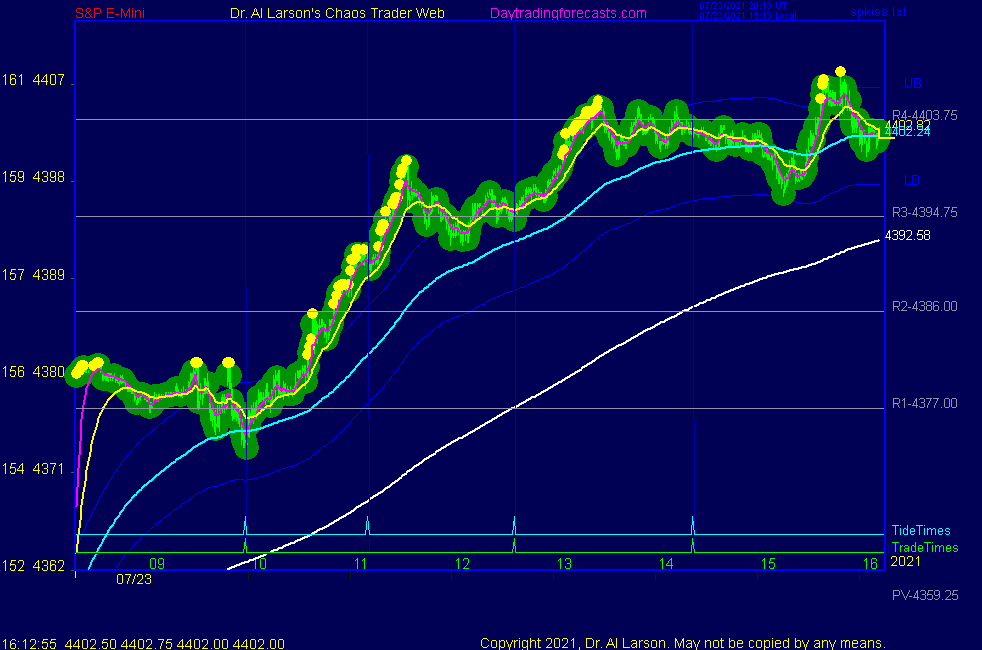
7/23/2021 9:09:23 AM MT Al****:: note on chart 6 on SPKISS the rainbow of EXMAs is all up
7/23/2021 9:04:17 AM MT Al****:: the yellow vibe is about 4368. The next yellow is 45 point higher or 4413
7/23/2021 8:56:48 AM MT Al****:: note on the Secret->esnat72 chart the low on yellow vibe, resistance on white, now broken
7/23/2021 8:49:32 AM MT Al****:: chart 3 on SPKISS shows trade 1 as a continuation buy
7/23/2021 8:45:04 AM MT Al****:: broke through resistance
7/23/2021 7:48:33 AM MT qq:: $Trin opened at 14. Red Flag!
7/23/2021 7:13:25 AM MT Al****:: it is just above R1, and the +Mh315 is near S1
7/23/2021 7:11:31 AM MT Al****:: today prices are meeting resistance at the helio Mercury -Mh225
7/23/2021 6:35:01 AM MT Al****:: Good Morning visitors. Welcome to the Chaos Clinic.
The written Chaos Clinic is on the AUX page.
This site has a lot of charts,
so you may find it useful to have several of them available within your
browser. If you have a tabbed browser, you can open separate charts
in separate tabs by right clicking on any link, and selecting "open in new tab"
from the menu. The main list of site pages is at
http://daytradingforecasts.com/chartlistsec.asp
Recommended pages to watch are SPKISS, MTRainbow, and Chat.
For astro stuff, add SPSunMoon, Wheel, and Chaos Clinic.
A special set of Dr. Al's research charts are on the Secret page.
Comments in the chat room are announced by a
"duck call" noise. This noise also occurs when the sofware detects a
resonant hex pattern on the Wheel page. MoonTide trading tutorials
are on the right side of the ListOfCharts page. One should
read Trading the MoonTide Tutorial and Keep it Simple as a minimum.
Many subcribers do not strictly trade the MoonTides, but use the charts on this
site as input to their own trading strategies. For example, charts 5 and 6 on the
SPKiss page are a good starting point for swing traders.
Also on this site is the Certified Chaos Trader's Room. That room is open
to graduates of my 4 main courses. See http://moneytide.com -> Courses for details.
9:00 Eastern-System: No comments
![]()
![]()