
2:07 flat; think I'll call it a day and leave the last trade as an exercise for the student
Thanks for coming; see you next week. Take a course or two.
1:42 I was probably too aggressive on both my entry and my stop; happens when I watch the screen too long
1:41 stopped for -1.5
1:35 putting a buy limit at 1962.5 ; 90 degrees + .5 and a target from doing the CTME course homework
1:32 stop to 1968.5
1:28 not a lot of juice ; but it may be coming
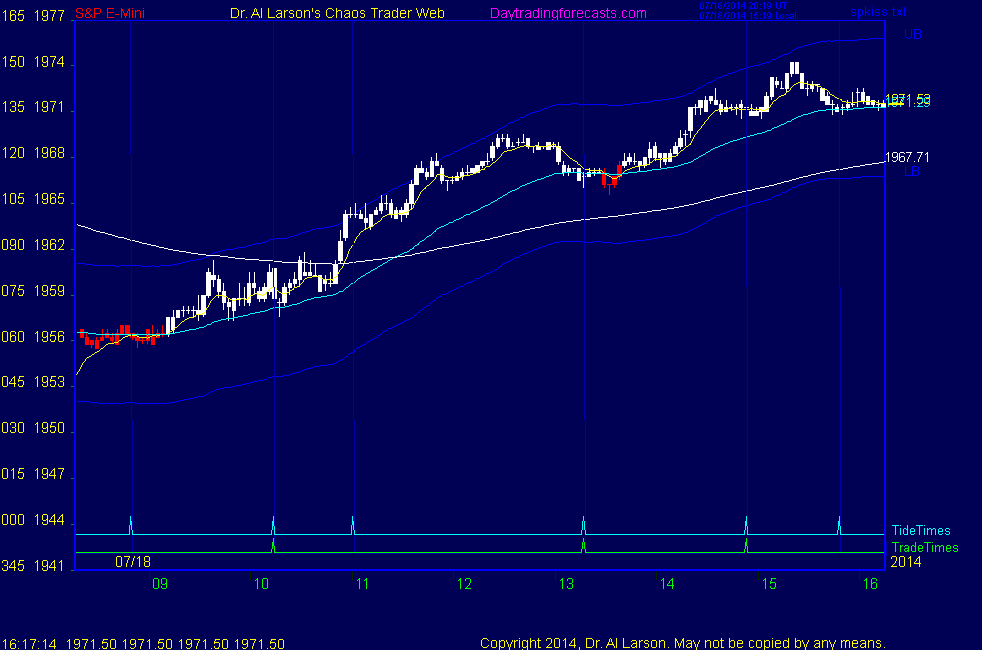
1:18 turned down at Sun and Mars timelines as they square; 1967.25 is their price flux value
1:16 stop to 1969.5
1:07 pressing a bit, sold 1967 stop 1970
1:00 doing a little research tells me we could have some volatility near 14:02
12:57 on my 2 day charts, the rally has retraced a harmonic 3/4 the drop
12:52 the 55 minute EXMA is about 1968; watching for it to turn down.
110 is about 1966.62, so need to break about 1965.5 to generate much selling
12:44 updated my Face of God chart in the CCT Room
12:41 up to about the same price at the same time as yesterday
12:32 on the Chaos Clinic chart you can see prices still riding the white up minor swan
below it is the green swan, being followed by the 110 EXMA. Need to break below both to reverse the rally
12:24 on a rally like this, it will not be over until a 55 minute EXMA turns down
12:16 seems to be loosing some momentum - still looks like following the green +Tide
11:45 the 440 EXMA has now turned up, so we should hold up into the close, but may not rally much more
we are about 18 points above yesterday's late outcry low
11:37 paused there, then punched through; green swan caught hold
11:04 overhead resistance is at 1965.5
11:02 we are seeing the effect of the green swan - see the Chaos Clinic chart
11:00 happily my little autotrader on AUX page held for +7
10:56 I'm not chasing this; got some already; also at a Tide time
10:51 getting some buying
10:44 slipped off of that; still in a move 4 congestion
10:35 on Chaos Clinic chart, prices are trying to climb a minor Black Swan line
10:32 testing the 1961.5 resistance level - see AUX chart
10:22 congesting sideways
10:17 looking weak
10:03 I have placed a Face of God chart in the Certified Chaos Trader's Room. That room is open
to graduates of my 4 main courses. See http://moneytide.com -> Courses for details.
eMylar Face of God overlays help you be patient, since they show you future potential moves.
The best bargain in my courses is to take the Cash In On Chaos and Fractal of Pi courses and
learn to use the FOP overlay. Then take Chaos Trading Made Easy, and finish with Face Of God.
9:57 On Fridays, the volatility is usually all in the morning. Today's early volatility is low.
9:51 I feel luck to get 3 points there, so I'm just watching now. Move 4 can congest several hours.
9:47 on my 2 day charts, this is move 4 of 7 in a down Chaos Clamshell. We may congest for a while.
9:39 I set my target just under the 440 EXMA, knowing this was a counter trend rally on a two day spliced chart
That point was also .5 under the harmonic price level mentioned earlier.
9:38 out for +3 ; trade was going into the trade time
9:36 stop to 1958
9:35 stop to 1957
9:33 stop to 1956
9:31 taking a buy at 1958, stop 1955, target 1961
9:29 On my 2 day 8 hour spliced charts, we already have a 20/110 buy crossing; waiting to see the outcry opening
9:22 On that chart, there is harmonic overhead resistance at 1961.5 ; that is about the level of the down sloping 440 minute EXMA
9:15 on the Aux page I'm showing one of my research charts that covers 24 hours. It shows prices following the green +Tide.
It also shows an autotrader that has already made 3 trades, all small losers. So there is more chop than yesterday.
9:01 We do have a green swan crossing the Moon flux near the first trade time. We will have to watch it for a possible rally out of the range just mentioned.
8:58 the Chaos Clinic chart shows prices hanging under a pair of Moon electric field flux lines, which
cross near 14:30 Eastern. These may establish a range of about 1948 to 1958.
8:51 today's trade times are 10:14, 13:17, and 14:53. The MTRainbow chart shows the flow is down.
But we may see a flat day as yesterday's events are digested.
8:50 Good Morning. Welcome to the Chaos Clinic. This site has a lot of charts,
so you may find it useful to have several of them available within your
browser. If you have a tabbed browser, you can open separate charts
in separate tabs by right clicking on any link, and selecting "open in new tab"
from the menu. The main list of site pages is at
http://daytradingforecasts.com/chartlistsec.asp
Recommended pages to watch are SPKISS, MTRainbow, and Chat.
For astro stuff, add SPSunMoonMer, Wheel, and Chaos Clinic.
Chaos clinic comments appear at the bottom of the SPKISS, MTRainbow,
and ChaosClinic pages. Comments in the chat room are announced by a
"duck call" noise. This noise also occurs when the sofware detects a
resonant hex pattern on the Wheel page. Trading tutorials
are on the right side of the ListOfCharts page. One should
read Trading the MoonTide Tutorial and Keep it Simple as a minimum.
The eMylar overlays can be used with any trading software, since they are external to it. A sample can be downloaded from MoneyTide.com
7/18/2014 8:09:03 AM MT awe:: GM Dr Al. after taking the 2 courses does one build their own overlays or buy them? thanks and all the best, Will
7/18/2014 6:49:05 AM MT Al****:: GM all-good luck today
7/18/2014 6:01:38 AM MT mm****:: gm all - have a great day
9:00 Eastern-System: No comments
![]()
![]()