
2:21 I do think we hold up the rest of the day. I'm done for the day. Thanks for coming. See you next week. Take a course.
2:19 some days the hotline trades are not clean enough, or i'm not sharp enough, so I'd rather make no trades at all
2:16 by rule I'm passing on this second trade
2:13 9 point retrace of 18 point move
2:10 about another 10 minutes in the window
2:01 getting late in the trade window
1:54 updated my FOP chart
1:49 I'm still seeing a thrust and a correction, so only interested in a buy
1:47 posted a FOP in the CCT room
1:43 still not clear to me, so waiting
1:36 looking positive - watching for an entry
1:30 I want to see how we come out of this Tide time
1:09 also, one has to look at the pattern-thrust, then correction. One would expect another thrust up
1:04 dipping into the trade time-have a 20/110 sell, but suspect it is a head fake because of the low volatility
12:49 coming in to the second trade window - prices being supported by the 110 EXMA - watching for a buy opportunity
12:47 volatility has died
12:40 the market has now held up nearly 3 hours, which usually means the rest of the day is flat to up
12:22 I don't usually teach anything about the astro stuff because it is complex. But I will point out
one thing about the Moon flux lines. There are up and down flux lines. They tend to have up and down influences.
Today we have up and down ones close to each other. That represents a battle. We got a bounce up into this battle zone
and now are conjesting. Yesterday the flux lines were further apart, and set the first high and then the low.
Then they battled, until late in the day the down influence took hold. This morning, with the news, I expected
prices to trade near the next lower set of Moon flux, near 1339-1342. When they weren't doing that,
I covered my swing trade short. The separation between the up and down Moon flux gives you a clue about the type of day it might be.
12:00 the juice has dried up - sometimes on Friday it all comes early, then the market drifts
happened last Friday
11:48 one cannot let missing a good move bother you-you have missed thousands of them historically -
take the information they provide and look ahead - if this is a longer term CIT, the fractal is just beginning
11:43 rally looks to be over
11:35 18 point move from the low - 1/4 Wheel of 72; OK, just 17.75 but close enough
11:32 posted another FOP chart in the CCT room
11:13 breaking that zone - not chasing it because it would not be a good entry
11:08 this zone between the two Moon flux is a balance zone. See the SPSunMoonMer chart
11:02 we may now pull back into the second trade time. I'll try to be patient and wait.
10:52 Mercury +M270 square Moon +T000 flux is support near 1357
10:48 rally was stopped by the Moon -T090 electric field flux, which set yesterday's high
10:37 looks like the trade for this trade time was a buy going into it. Missed it, so I'll wait
10:23 the 440 EXMA was broken and is now curling up. My down FOP has fractured, so we may be seing a longer term change in trend.
10:06 on the MTRainbow chart, prices bounced up to the white 440 EXMA. This acts as resistance.
10:04 if you have your sound card on you heard the "duck call" annoucing a hex pattern formed by
Mars, Mercury, Chiron, and Pluto. See the link Hex Wheels today, on the right side of the ListOfCharts page,
and the Hex Wheel tutorial, also linked on the right side of the list of charts page.
9:53 the Fractal of Pi is one of my favorite tools. I use it for day trading, swing trading, and position trading.
The eMylar Fractal of Pi overlays help me be patient, since they show me future potential moves.
For example, I used it yesterday to identify this potential drop, sold multiple contracts 1357, covered this morning 1347
The best bargain in my courses is to take the Cash In On Chaos and Fractal of Pi courses and
learn to use the FOP overlay
9:51 this is a "gap down" day. A common pattern is for a rally into about 11:00, then a continuation of the decline.
9:48 I have placed a Fractal of Pi chart in the Certified Chaos Trader's Room. That room is open
to graduates of my 4 main courses. See http://moneytide.com -> Courses for details.
9:33 found support 18 points, 1/4 of Wheel of 72, down from yesterday's high
9:32 this market has a strange feel to it - not down that hard considering the JPMorgan news
9:20 may be a hard day for day trading becuase the big change came overnight - we shall see
9:08 trade times today are 10:48 and 13:33 . MTrainbow chart shows trend is down
9:00 Good Morning. Welcome to the Chaos Clinic. This site has a lot of charts,
so you may find it useful to have several of them available within your
browser. If you have a tabbed browser, you can open separate charts
in separate tabs by right clicking on any link, and selecting "open in new tab"
from the menu. The main list of site pages is at
http://daytradingforecasts.com/chartlistsec.asp
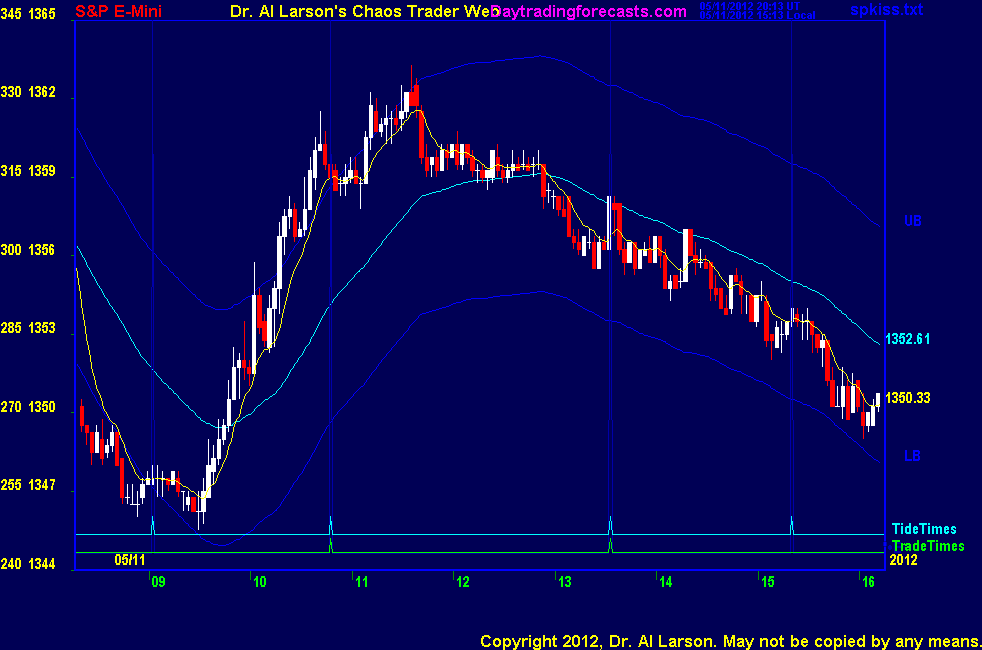
Recommended pages to watch are SPKISS, MTRainbow, and Chat.
For astro stuff, add SPSunMoonMer, Wheel, and Chaos Clinic.
Chaos clinic comments appear at the bottom of the SPKISS, MTRainbow,
and ChaosClinic pages. Comments in the chat room are announced by a
"duck call" noise. This noise also occurs when the sofware detects a
resonant hex pattern on the Wheel page. Trading tutorials
are on the righty side of the ListOfCharts page. One should
read Trading the MoonTide Tutorial and Keep it Simple as a minimum.
9:00 Eastern-System: No comments
![]()
![]()