
Chaos Clinic Recap
Here are Al's comments
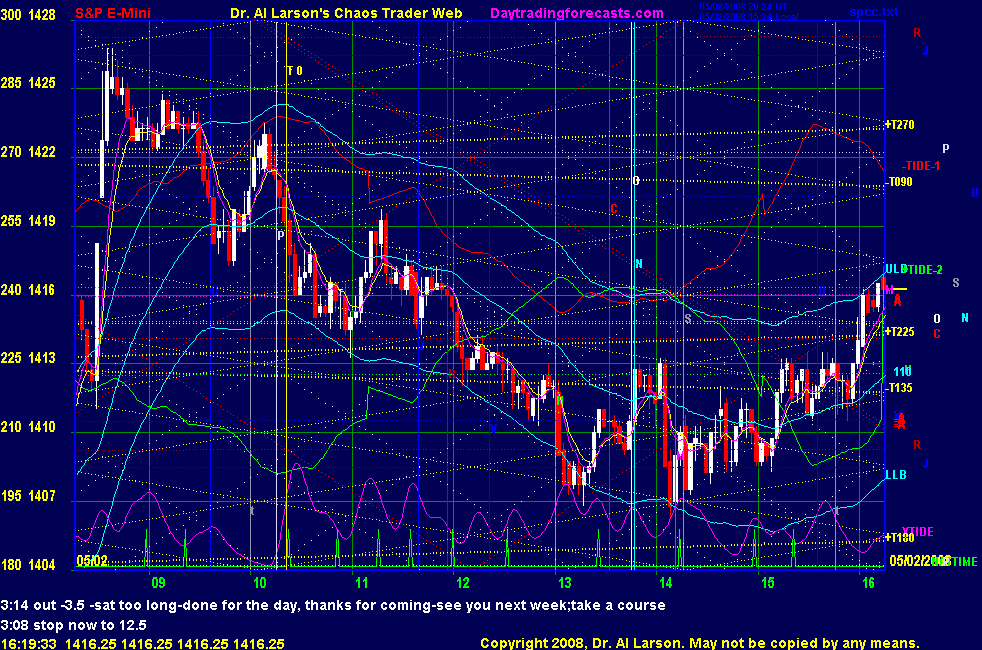
3:14 out -3.5 -sat too long-done for the day, thanks for coming-see you next week;take a course
3:08 stop now to 12.5
2:56 looks like specialists "trading out their paper" to afford a decline
2:44 just holding tight
2:27 after a move like that, things may stall for 8 to 12 3minute candles
2:24 I'm a little ticked that I got hit by that big bar, because it was the Franklin cycle turning down
just too buys to see it in time to abort
2:21 that last push make a marginal lower low, but it says no time for any major buying;the sellers have more to sell
2:13 because of the jump in volatility, I have to put my stop above the last high; Looks like inverted to green Tide
2:10 this is the biggest red candle in the outcry session-if you get hit by one you must go with it on that bar
2:09 sold 9 stop 14-got a 20/110 "hook and go"
2:06 whacked for -3 ; in too soon
2:03 bought 12 stop 9
1:58 in this minor cycle we are on the 5th candle, so have about 4 to go -12 minutes
1:56 you can count the number of candles from low to low to get an idea of the near term cycles-I coun 9, for 27 minutes
1:51 We have the Mercury timeline right on a Natural Time point about 14:15, so maybe I can find an entry then
1:47 now comes the real energy, up the hot Neptune/Node timelines mentioned early in the day
looks like we are turning up, so I'm looking for an entry point.
1:41 I was off answering a question in the cdaht room-the pretend candlestick trade was stopped for zero
a real CandleNut would have been out on a stop under the first red bar
1:34 note we are still mostly in the down dotted white diagonal channel- if we break out of it we could rally a bit
going into the close
1:29 pretend trade stop now to 1409 - under low of second white candle
1:26 trading a spike low like this takes experience, so if you try it, be careful. Our normal rules are for all, including newbies.
1:22 this is not a technique we use for the hotline trades, so we'll just watch it - pretend long from 1409, stop 1406.5, cover 1412
1:17 the sharp drop gives room for at least a minor rally-a common candlestick trade would be to put a buy stop at 1409
A stop for that would be 1406.5, under the last low, with a target of 1412;
1:10 now 3 red bars, watching for a white one; there was a cangel stick quicky there, but if you are not in near
the top of the first big bar, let it go.
1:06 big red bar at exact tide time - smells like a low -waiting
12:58 prices at Sun+180 degrees as pass solar noon-no accident-just Market AstroPhysics in action
12:54 we were also at the early pre-outcry low, which was bound to attract buying from short covering
12:52 there, the candles were not all red, telling me buying was coming in more than on the last downswing
12:51 coming to next Tide time, so I'll take +4 here, and see how we come out of it
12:47 candle tops and -T135 Moon flux tell me I can move stop to 12.5
12:45 stop to 13, locking 2
12:42 stop to 13.5
12:37 finally chewed through the Moon flux support
12:36 a 50% retrace of the rally from yesterday's low is about 1405
12:30 now stop to 15; break even
12:28 looking at the Wheel of Fortune tells me we could drop to 1405, 180 to Moon conjoin natal Moon
12:23 the 110 EXMA has dropped below my stop, so I'm sitting tight
12:19 still OK-top wick below my stop
12:15 white candles- stop as tight as I dare
12:11 stuck between the +T225 and -T135 Moon flux
12:05 stop to 16
12:02 looking OK now-if we get a rout going, we could drop into the close; Jude 3 just sold
11:55 getting top wicks on candles, and 20 EXMA staying under the 110
11:51 hanging fire -all I can do is wait
11:38 I'm reselling on the 20/110 continuation sell at 1415 stop 1418; the 110 EXMA is curling over
11:34 so far neither my Franklin nor my Jude3 autotraders have made a trade - I think they are still in bed
11:24 if you find the down diagonal yellow line off the high and the up one off the low, you see a converging triangle.
The diagonal yellow lines are the MoonTide Harmonic Grid
11:22 the bulls and the bears battled to a draw-so I expect it to get dull
11:12 change that to "were resistance"; now we are in a trading range; just watch until next trade time at 13:05
11:08 the low was a big wick white candle off the Moon T+225 flux. Mercury and Saturn are resistance
11:05 the MoonTides forecast the shape of the 110 minute EXMA. Note that the Upper 110+4.5 points is following the red -Tide.
But we have dropped to the lower green +Tide-the two form a MoonTide Fractal Set.
11:01 OK, the 5 points was there. No regrets at not getting it all. Only pigs try for that. They become bacon.
10:57 support on them suggests a "price to time" rally until the Neptune/Node vertical timelines near 1:45
10:55 there I saw a white candle that was all bottom wick, making a double bottom on the Node white O and
Neptune N cyan flux
10:54 don't like the stall-out +3
10:51 bigger white candle-stop is just above it's wick
10:46 being attracted to the Mercury Magenta M flux line
10:44 stop to 17-tell myself "I got my second 25 grand."
10:40 stop to 18
10:39 my entry was late because I was typing, so I will cover at 5 points=1414
10:37 it is normal to get a correction of 3 to 6 candles-here I see top wicks, so OK if I don't get stopped out
10:32 white candle means start of minor rally-want to be sure my stop is in a no loose position
10:27 stop 19-string of red candles-watching for a white one; both red -Tide and XTide2Plus are down
10:25 stop 20-the Moon near 10:00 is always exciting-trying to not get caught up in it
10:24 sold 19, stop 21
10:21 I need to be patient here. I tell myself "I got my $25,000" - that is what 2 points each day is worth in a year
10:17 I have a high respect for the Moon flux lines, so when I saw the red candle ther, I covered, knowing that
that this could be the red -Tide high
10:13 taking 2
10:06 coming to the Moon T0 timeline-should be hot- stop 21
10:05 stop 1420.5
10:03 stop to 1420, at the 20 EXMA and my entry; up to the Moon flux pinch, so watching for a stall
9:57 bought just above the wicks of the indecision, at 1420, stop 1417
9:55 we have now stalled on the 110 EXMA, and the candles are alternating color=indecision
9:51 a red candle is bearish, white is bullish; watch the runs, and the top and bottom wicks; big wicks warn of change in direction-top wick says rally weakening, bottom wick say decline weakening
9:45 I just changed the SPKISS and the Chaos Clinic chart to show basic 3 minute candlesticks, so I can comment on
how they fit in with my stuff.
9:39 note the double dotted diagonal down white line-S&P harmonic grid-forming channel in the electric field
9:37 Broke the 1422 support - so starting out following the green +Tide
9:17 with this jump added to yesterday's rally, we are on top of Mt Everest gasping for air; expect a pullback
9:08 jump on jobs report sent prices from Sun (green H) flux 1412 to Mars(red R) and Jupiter (blue J) 1426.5
then sag to support at yellow Moon T+270/Pluto flux 1422.25. Come to their timelines about 10:19, first trade time.
9:00 Good morning from Chaos Manor
Besides the comments made by Al, the chat room is has live
comments from other traders who sometimes share their views,
trades and tips. Below are the chat room comments from this clinic
5/2/2008 12:04:11 PM Mountain b:: Thank you. I will read about it. Looking at the clinic chart, would you anticipate the market moving up to sideways until pass the purple line? And then a rally to close if it continues to follow the same moon line? I am trying to fix my eyes on what you are discussing in the clinic. Thanks again.
5/2/2008 11:44:31 AM Mountain Al:: see the tutorial on the List Of Charts page, right side, for how we trade the hotline. Then look at the Past Emails to see three years of archived nighly emails. Please note that I only do the Chaos CLinc comments on Fridays. Your suscription gives you acces to all the charts on this site Monday-Thursday.
Sign up for the free Weekly email on Moneytide.com to get the email for the free Friday session.
5/2/2008 11:40:03 AM Mountain Al:: yes-go to moneytide.com to see our products under Catalog
5/2/2008 11:35:58 AM Mountain b:: Hotline trades? Is that a service that you offer?
5/2/2008 11:06:33 AM Mountain Al:: no, just refresh-this is cause by my server being overloaded by all those coming to watch something free
5/2/2008 11:01:28 AM Mountain b:: In the clinic, the chart will disappear when updating and comes back to a white box with a red x in it. I get that often. Is there a way to correct it?
5/2/2008 9:59:24 AM Mountain bm:: Hello Al, the Moon flux line is a strong resistance line
5/2/2008 9:08:24 AM Mountain Al:: right TG-thanks-doing too much at once :) -glad you graduates look after me
5/2/2008 9:01:07 AM Mountain TG:: Pretty sure Al had a typo in last comment. 8:15-16:15 EST is usually what his timeframe is set at.
5/2/2008 8:24:18 AM Mountain Al:: gd-make sure you are using the same time window I am 6:15-4:15 Eastern
5/2/2008 8:21:58 AM Mountain jb:: I believe Al is using a 3 min chart. His 20 min XMA is 7 bar XMA on the 3 min and the 110 is a 36 bar XMA.
5/2/2008 8:17:56 AM Mountain gd:: Hello,
I'm still confused as to what time frame my chart should be set to? I am currently using a 1 minute chart with the 20 and 110 ma's. But my chart does not resemble Al's chart. What am I doing wrong?
Thanks.
5/2/2008 7:10:23 AM Mountain Al:: GM all - good luck today
5/2/2008 5:43:53 AM Mountain mm:: gm all - have a great day
9:00 Eastern-System: No comments


[ Live Clinics on Friday on DaytradingForecasts.com ]