![]()
![]()
********************************************************************************
The S&P and Two Moon Days
Chaos Clinic for 4/30/2021
********************************************************************************
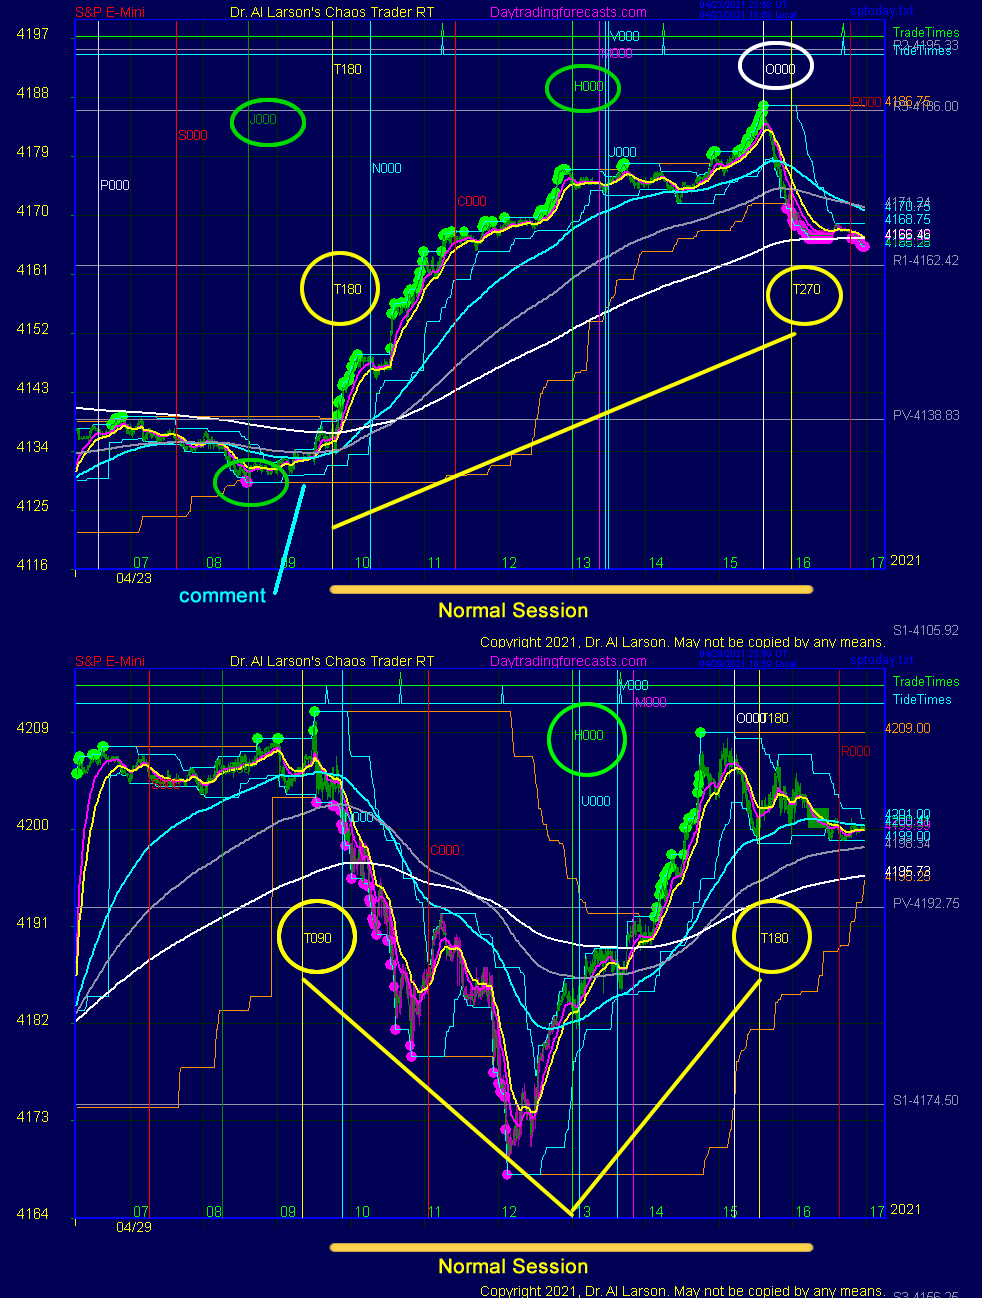
The charts above shows the S&P futures on 4/23/2021 and 4/29/2021 .
They shows what I call a "Two Moon Day." These are days when the rotating Earth
moves the New York Stock Exchange to form an aspect of 0, 90, 180, or 270 degrees
to the Moon.
Two Moon days are often volatile, and tend to move Moon to Moon, or Moon, Noon, Moon.
On the top chart these Moon timelines are shown by the vertical yellow lines,
labelled T180 and T270. The 180 is the 180 degree opposition, and the 270 is a square.
This chart was from a Chaos Clinic day, and just before the outcry session I made
a comment in the chat room to watch for a Two Moon Day.
I thought this pattern might develop based on the minor low near 8:30, which came precisely
at the time that the Exchange rotated to align with Jupiter (J000). Following that point
the rainbow of EXMAs turned up. These are the usual 20, 110, 220, and 440 minute EXMAs
used on http://daytradingforecasts.com.
Also shown on the chart are "pit pivot" prices. These are harmonic price levels computed
from the prior day's trading. The green and pink "push balls" highlight buying and
selling pressures.
The other vertical lines show the Exchange aligning with Pluto (P), Saturn (S), Jupiter (J),
Neptune (N), Chiron (C), Sun (H), Venus (V), Uranus (U), Node (O), and Mars (R).
Note that the rally slowed and went flat at solar noon, H. Then near the end of the
trading day the rally resumed with a fast move up to the Node timeline. The high was
EXACTLY on the Node timeline, just as the low was EXACTLY on the Jupiter timeline.
While the general "Two Moon" tendency was present, the exactness of the high and low
are strong evidence that even in this time of computerized trading, that the
energy the algos track is related to the complex electromagnetic field of our
solar system.
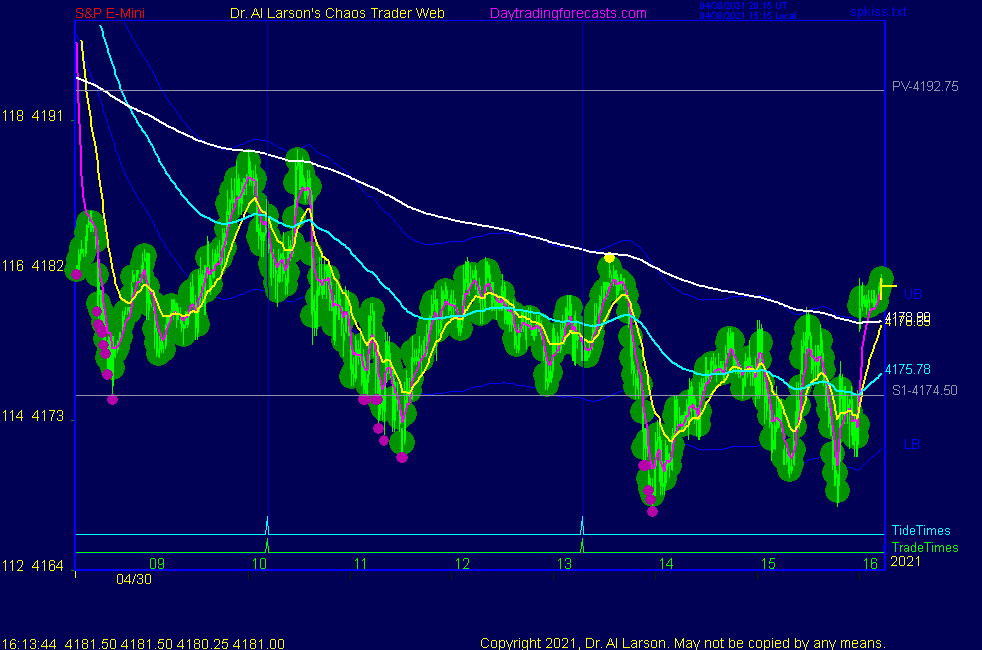
The second chart is six days later. It is a good example of the Moon-Noon-Moon pattern.
One can watch for Two Moon Days by looking at the SPSunMoon chart on http://daytradingforecasts.com
For more on my work and to subscribe to Tomorrow's Market Email Hotline and access to daytradingforecasts.com see
Moneytide.com
Software to plot electric field flux lines in NinjaTrader is available at
energyfieldtrading.com
4/30/2021 1:28:14 PM MT Al****:: OK, I'm done-thanks for coming-see you next week-take some courses
4/30/2021 1:13:33 PM MT .:: I would also like to see how the inversions can be anticipated. If you would not mind I would ask Al for your email.
4/30/2021 1:09:49 PM MT Al****:: on the Secret charts notice the vertical lines right at the end of the day
4/30/2021 1:06:13 PM MT Al****:: I have posted a Fractal Of Pi chart in the Certified Chaos Trader's room
4/30/2021 1:04:14 PM MT Al****:: I am interested in your comments re inversions-could you send me an email with more?
4/30/2021 12:45:31 PM MT Al****:: DWY: neither XGO nor MoonTides are smoothed -they are just computations of energy -neither is a perfect model
4/30/2021 12:35:11 PM MT DWY:: Al, wee bit of information. Deterministic polarities=> Inversions are determinstic too=> Inversions are predictable.
4/30/2021 12:31:46 PM MT DWY:: Astro Events are relative to frame. Keep in mind: space can be measured in time and time measured in space. The POLARITY is the task to be determined. Polarities of events are deterministic and predictable too. The ONLY reason an astro graph like XGO or bradley need to be shifted is due to lag of the smoothing algo. Horizontal Translating an astro measure is a RARE process because it means the algo is WRONG, due to fixed lag of the algo. This applies to the moontide algo too.
4/30/2021 12:11:57 PM MT ..:: On the M15 chart there is a lovely 7 wave fractal.
4/30/2021 12:10:46 PM MT ..:: Totally see where you are coming from Al a form of fribulation to give it a technical name.
4/30/2021 12:07:14 PM MT Al****:: there is a subtle thing going on - Last Friday the Moon to Moon was a 6 hour period; Yesteday the Moon-Noon-Moon was a 3 hour ; today the cycle is 1.5 hours. This is frequency doubling, a precursor to chaos
4/30/2021 12:05:06 PM MT ..:: Last year on the 29th we also had a high, Ganns yearly cycle point
4/30/2021 12:02:58 PM MT ..:: sure it is very complex I understand that, It is like astro relationships they are never the same because other planets are involved and the sun is currently travelling through the solar system. No event will be the same for billions of years.
4/30/2021 12:00:33 PM MT Al****:: the problem with doing statistics is that each event is not independent - all energies add together
4/30/2021 11:57:58 AM MT Al****:: Venus and Mercury set up a sell
4/30/2021 11:56:34 AM MT ..:: Unless you know the probability, you are basically unable to trade effectively. Sure the MA gives you a hint of direction. Your comment we made a higher low at the solar noon, again what is the probibility the market will stay up. Have you done the maths on it?
4/30/2021 11:48:21 AM MT ..:: Âl you have been at this a while, sometimes it works sometimes it fails. Have you ever worked out the probability that a astro event will actually reverse a trend
4/30/2021 11:38:05 AM MT Al****:: Mercury is 144 degrees, pentile the Moon so is timeline t may be hot
4/30/2021 11:29:35 AM MT Al****:: energy starting to come in now as Exchange passes Venus and Mercury
4/30/2021 11:22:37 AM MT Al****:: my Chaos Trading Made Easy chart suggest buying coming in near 1:40 Eastern
4/30/2021 11:09:42 AM MT Al****:: higher low at solar noon
4/30/2021 11:06:35 AM MT Al****:: hi there BBB. Doing Ok. How about you?
4/30/2021 11:02:27 AM MT bbb****:: Hey Al, I hope all is going well for you.
4/30/2021 11:01:13 AM MT Al****:: on a slow day like this the 20/110 EXMA crossings become too frequent to be good signals
4/30/2021 10:51:23 AM MT Al****:: pretty good fit to chart 1 on SPKISS page
4/30/2021 10:45:59 AM MT Al****:: now we have a little 1-2 off the low - watching for energy as pass solar noon
4/30/2021 10:13:29 AM MT Al****:: Today's low was higher than yesterday's and on a 24 hour
chart there are 7 swings down from yesterday's late high,
so rest of the day may be up
4/30/2021 9:47:20 AM MT Al****:: that makes 3 slightly lower lows in last 5 hours on 24 hour charts, a pattern traders call "three drives to a low"
4/30/2021 9:36:43 AM MT Al****:: found support on the green vibrations level on Secret->esnat72
4/30/2021 9:12:58 AM MT Al****:: little double bottom on S1 - as expected, not a lot of juice - note chart 4 on SPKISS page
4/30/2021 8:14:41 AM MT Al****:: on secret->esnat360 note that yesterdays Two Moon Day was a double top on the green vibration level
this may be important longer term, given that this week the S&P basically went nowhere
4/30/2021 8:09:17 AM MT Al****:: on secret->esnat72 note 1)the Flash Boys sold the pivot, then bought S1 and 2) the yellow vibration level was support, is now resistance
4/30/2021 8:02:36 AM MT Al****:: today may not be that volatile because it is the last trading day of the month
and the Moon is near 270 degrees, vertical. This weakens its
effect.
4/30/2021 6:32:02 AM MT Al****:: Good Morning visitors. Welcome to the Chaos Clinic.
The written Chaos Clinic is on the AUX page.
This site has a lot of charts,
so you may find it useful to have several of them available within your
browser. If you have a tabbed browser, you can open separate charts
in separate tabs by right clicking on any link, and selecting "open in new tab"
from the menu. The main list of site pages is at
http://daytradingforecasts.com/chartlistsec.asp
Recommended pages to watch are SPKISS, MTRainbow, and Chat.
For astro stuff, add SPSunMoon, Wheel, and Chaos Clinic.
A special set of Dr. Al's research charts are on the Secret page.
Comments in the chat room are announced by a
"duck call" noise. This noise also occurs when the sofware detects a
resonant hex pattern on the Wheel page. MoonTide trading tutorials
are on the right side of the ListOfCharts page. One should
read Trading the MoonTide Tutorial and Keep it Simple as a minimum.
Many subcribers do not strictly trade the MoonTides, but use the charts on this
site as input to their own trading strategies. For example, the bottom chart on the
SPKiss page is good starting point for swing traders.
Also on this site is the Certified Chaos Trader's Room. That room is open
to graduates of my 4 main courses. See http://moneytide.com -> Courses for details.
9:00 Eastern-System: No comments
![]()
![]()