
Chaos Clinic Recap
Here are Al's comments
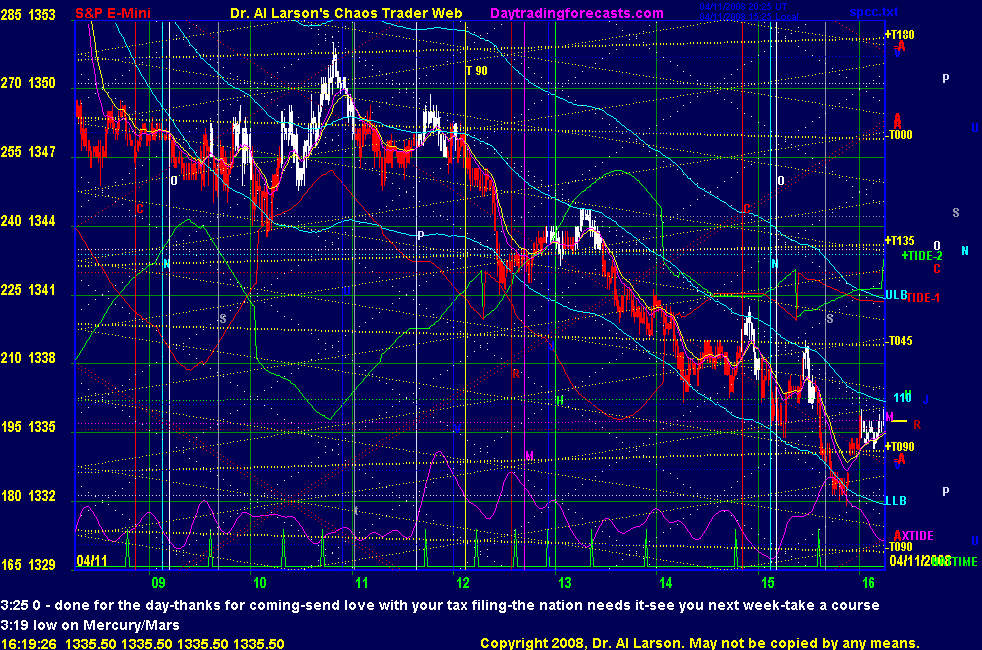
3:25 0 - done for the day-thanks for coming-send love with your tax filing-the nation needs it-see you next week-take a course
3:19 low on Mercury/Mars
3:14 stop 38
3:11 stop 39.5
3:08 just broke the Sun+180 support
3:03 stop 41; note the channel formed by the dotted white S&P Grid lines
3:02 passing through the Chiron/Node/Neptune timelines - obviously hot
2:58 resold 38 stop 42
2:56 this rally looks like move 6 of 7 in the down Chaos Clamshell-I'll hang around to see if I should resell
2:53 in answer to the question in the chat room, the purple XTide line at the bottom of the Chaos Clinic chart
is a very short term forecast of "noise" in the system - it was the seed for XTide2Plus, which is different
2:51 +.5
2:45 stop 39.5
2:44 "If you can wait, and not be tired by waiting ..." If by Kipling
2:40 low of last hour was resistance
2:30 stalling a bit-stop is where it should be; note the 110 steepening
2:20 support 180 degrees to Sun-see Wheel of Fortune
2:15 stop 40-I may just ride this one
2:11 stop 42
2:07 110 EXMA is steadily down
2:01 slow mover-but it should accelerate after 2:30-just need to be patient
1:54 stop 1343
1:48 the last high -18 is 1326.75 - sounds like a theme -we shall see
1:45 looks OK - I was a bit slow to enter because I was being cautious-happens
1:35 40 stop sold me short, put buy stop at 44
1:33 this could be a red -Tide low, so need to be flexible
1:29 putting sell stop 1340 in case of collapse, and looking to sell near 1343.5
1:24 looks like setting up a continuation sell going into this Tide time-but waiting to see how we
come out of the turn
1:17 the balance price for this pattern is 1345.5
1:10 the first two Tide times were very close, and not early, so I will wait until after the next one
12:55 I expect more selling to come in about the next Tide time, so will watch for a good sell setup
12:52 this looks to be move 4 of 7 in a down Chaos Clamshell off the high
12:50 out +5 ; stalling
12:45 stop OK - Moon T+135 was resistance, marking half way to T+90
12:36 an 18 point range is 1334-the Moon T+90 price flux
12:31 a targeting echnique from the Chaos Trading Made Easy course gives about 1327 for the end of fractal
Interesting-that is the Saturn price - see the Wheel of Fortune
12:28 stop 44; 39 is my 9 point cover if we get there
12:26 stop 46-lock 2
12:23 moving lower-stop 49.5; that SA/SR did what I anticipated ; knowledge of chaos theory helps
12:15 the 110 EXMA is down, and prices and the 20 EXMA are staying below it-bearish
12:10 stop now to 50.25
12:07 getting the replling down action mentioned earlier
12:01 virating on the square of Uranus. U adds rotation , so watch for a slow rollover, which then speeds up
11:47 the point where the Moon T90 timeline and +180 price flux cross is a chaotic strange attractor/repellor
once we pass it it time it should repel prices down unless they get above 1352
11:40 very dull -must be a lot of "what do we do" meetings going on
11:27 that high was hit by a second wave of selling off of yesterdays's close-in a couple of hours should
see a third wave of selling, so may end the day on green +Tide
11:12 picture is clearer now-tracking red -Tide
11:02 sold 48 stop 52-got a "hook and go" reversal off the Moon T+180 flux
11:01 aborted -2; 110 lost its curl
10:51 a 50% retrace is about 1356-so will jut take 5 if I get it ; Jude 3 just bought
10:47 stop 48-under the 20/110 EXMA crossing
10:43 bought 50.5 stop 47
10:42 a break of 51 will trigger buys
10:36 looking for a buy setup
10:31 I am running my Jude 3 auto trader on the Aux page-it is flat
10:27 getting unproductive vertical grease pops-Moon at top of wheel
10:18 looks like a low is in-now watch to see if the bulls can get a rally going
10:12 there is a crossing in the diagonal yellow MoonTide Harmonic grid coming up-after passing it we should see
a change in volatility
10:08 dip to the Saturn support near 1344.5
10:00 patience isn not only a virtue, but absoluely essential in trading-have to wait for the right conditions
for a trade - these are not them
9:52 a quick look at my Wingephi ephemeris tells me that Saturn is 8th harmonic to Mercury and 5th to Venus
so those two should be hot today; Venus is also square the Moon-timelines near 12:00
9:49 just passed the vertical grey Saturn (S) timeline-may have set a low
9:47 "Stunned" is the word that comes to mind here
9:44 below we have support at 1342.5 from Node/Neptune/Moon
9:36 overhead, we have two key resistance prices - Moon T+180 near 1352 and Mercury +270 near 1354
9:32 the 2 day chart (SP2Day page) shows an interesting pattern-a fast rally to 1368 = 0 degrees 72 point major quantum,
followed by a series of FIBRILATION swings, followed by a chaotic break - classic Market Astrophysics and Market Chaos Theory
9:22 going into the open the 110 EXMA using data from 6:15-4:15 Eastern is near 1352-well above prices.
This says to wait until they converge before looking for a trend change or trend continuation trade
9:15 bad news from GE shook market - oversold condition suggests a rally into the first trade time near 10:49
we have time to just relax and watch.
9:00 Good morning from Chaos Manor
Besides the comments made by Al, the chat room is has live
comments from other traders who sometimes share their views,
trades and tips. Below are the chat room comments from this clinic
4/11/2008 2:13:56 PM Mountain mm:: Al - thanks, but I have the 17th link as "SP 10 Day Moontides"
4/11/2008 11:20:48 AM Mountain jb:: Al, I checked the tutorials but I could not find what the purple tide lines at the bottom of the charts are. Is there a link or can you explain or is this only for paid subscribers?
4/11/2008 11:17:20 AM Mountain rnt:: Thanks Al, I owe a lot of my success to you!
4/11/2008 11:15:20 AM Mountain Al:: mt: Congrads on your success
4/11/2008 11:09:25 AM Mountain Al:: 17th link down on left side of List of Charts page
4/11/2008 11:01:29 AM Mountain mm:: rnt - I don't see an Xtide2 chart in the List of Charts. Where is it? Is it restricted?
4/11/2008 8:10:59 AM Mountain rnt:: If you guys have a minute you should look at the Xtide2 chart. Amazingly accurate, taht is the roadmap I have been using for the past year and made a fortune!
4/11/2008 8:10:51 AM Mountain Al:: investors, too
4/11/2008 8:10:14 AM Mountain Al:: traders
4/11/2008 8:07:09 AM Mountain rgh:: al,what is it that is "Stunned" or i should say "stunning"?rgh
4/11/2008 7:14:51 AM Mountain mm:: Thanks Al
4/11/2008 7:02:28 AM Mountain Al:: pivots fixed-data service failed last night - technocrap
4/11/2008 6:08:05 AM Mountain mm:: Al - SP1Day has not yet updated - thanks - have a good clinic
4/11/2008 6:05:40 AM Mountain mm:: gm all - have a great day
9:00 Eastern-System: No comments


[ Live Clinics on Friday on DaytradingForecasts.com ]