
Chaos Clinic Recap
Here are Al's comments
3:55 out for +2; now I am through
3:51 1269 would make an 18 point range
3:48 If still in, I will cover at 4:00
3:45 stop not hit; don't care if it is; hanging tough
3:40 last two highs were at 40 minutes past the hour
3:29 stop to 1275, above the 110 EXMA
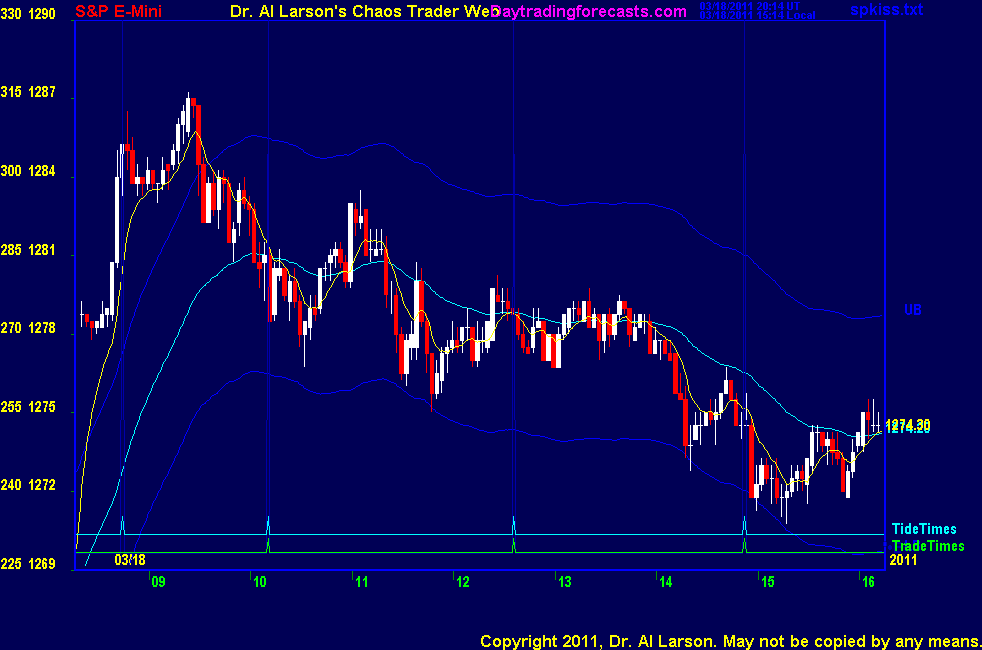
3:27 here I'm just watching a SPKISS chart
3:20 stop to 1276, just above the 110 EXMA
3:12 regular TG pointed out that this is quad witching day; added a lot of noise
3:08 focusing just on my stop, and on being patient
3:03 stop to 1277, just above the point where the 110 EXMA crossed the 440
2:58 lowering stop to 1278
2:50 this trade qualifies for the GO BIG rule, so I will try to carry it into the close
2:45 still OK; just waiting for the other shoe to drop
2:30 I'm having a problem with my physical stamina. Really wanted to leave
2:24 disengaging from doing the clinic helped me see that move setting up. I posted a new FOG chart in the CCT room.
2:19 OK, I did come back and take a look at the last trade-sold 1275 stop 1280
1:40 I am going to call it a day. This is a stinker. I've made several trades with small losses, which is OK.
looks like we hold up for the day. Thanks for coming; see you next week. Take a course.
1:38 aborted for -1
1:31 this move needs to continue; stop to 1280.25
1:27 the smell may be about to improve
1:24 in the chat room, regular MM is pointing out that this is turning into a stinker-I call them "MM stinkers"
1:21 one has to sit on a stop and wait and not react to the blips
1:15 there are times to act fast and times to act slowly; in a move 4, one needs to act slowly
1:12 move 4's are often choppy congestions and try your patience; you want to yell "Do something!"
1:00 back-still OK; move 5 is a fractal is the best one to catch if the first 4 are about the same size
12:42 taking a breakfast break; stop is in and me watching the pot boil is not doing any good
12:34 trade still OK ; from the high this is a move 4 of 7 down
12:27 I don't like this blip, but I'm holding fast; stop is in
12:14 posted a Face of God chart in the CCT room
12:11 sold 1278 stop 1281
12:04 pinched between the 440 and 110 EXMA's
11:48 continuation sell on the 20/110 entering second trade window -looking for a good entry
11:40 trading both sides of the 110-stay out and watch
11:38 updated my FOP in the CCT room
11:36 on the MTRainbow chart the 110 and 220 EXMA's have turned down, and the 440 is rolling over
11:31 so much for my bullish scenario
11:26 out for -2
11:23 down to the 1279 prime number; also the 220 minute EXMA
11:06 trade looking good. Moving stop to 1278
10:53 in trading, one will make mistakes. One has to immediately forget them and just keep going
10:47 rebought 1280 stop 1276; third time is a charm; more confident now that I found a FOP
10:45 support came on the Node/Sun flux
10:44 that fractal suggests the low of the day is in
10:40 I have placed a Fractal of Pi chart in the Certified Chaos Trader's Room. That room is open
to graduates of my 4 main courses. See http://moneytide.com -> Courses for details.
10:32 1277 is also a prime number
10:26 1279 is a prime number, looking like support
10:22 have a 20/110 sell, but the 110 is pretty flat; smells like a "hook and go"
10:15 range set by Uranus: +U315 to +U270 flux. Uranus is associated with earthquakes and uranium - hmm
10:08 I still think we hold up today.
10:04 out -3; pressing too hard
9:55 rebought at 1283 stop 1280; bounced off the 110 EXMA
9:53 looks like the Mercury +M279/Saturn +S090 electric field flux are support-on Chaos Clinc astro chart
9:50 looks like following the red -Tide, which does turn up soon
9:48 there I read the 20 EXMA as turning up and it did not.
9:47 aborted for -1; no go
9:45 bought 1283.5 stop 1280.5
9:42 trading around the Moon +T315 flux;
9:39 on the MTRainbow chart the 440 EXMA is up, but clear down near 1272
9:38 watching for a continuation buy opportunity
9:31 a day like this is hard to trade-about 15 point move since yesterday make further advance difficult
while the momentum makes any large decline unlikey
9:25 opening gap up - wild range for the week. Trade times today are 10:11, 12:36, and 14:52
9:00 Good morning from Chaos Manor
Besides the comments made by Al, the chat room is has live
comments from other traders who sometimes share their views,
trades and tips. Below are the chat room comments from this clinic
3/18/2011 11:50:08 AM MT TG****:: MM, since you mentioned 45 minutes, I noticed that the 2nd top that tested R4 was 45 minutes before the first trade time, the low right near R2 was 45 minutes before the 2nd trade time.
3/18/2011 11:39:54 AM MT TG****:: today is a quad witching day too.
3/18/2011 11:18:52 AM MT mm****:: this is developing into a typical Friday Stinker
3/18/2011 10:27:21 AM MT mm****:: The Master says 45 min
3/18/2011 10:00:55 AM MT TG****:: MM, what do you use as a trade window around the projected CIT. for example +/- 30 minutes, or maybe 15 minutes before to 45 minutes after the tide time?
3/18/2011 9:38:56 AM MT mm****:: and I did not like the projected wiggles - they are working !
3/18/2011 9:29:17 AM MT mm****:: TG - as I explained before - I don't just enter on every H or SS - this one was relatively close to a projected CIT - but it was not on a S/R level
3/18/2011 9:15:04 AM MT Al****:: I'll look at those issues. My request code specifically askes for theopen and close. I'll see tonight if I really get them.
3/18/2011 9:09:09 AM MT TG****:: Al, that ticker, when I check it around 4:40 or so gives the daily high and low during the outcry session. It doesn't give the open and I have to infer the close from the current price and the amount of change it shows.
3/18/2011 9:07:18 AM MT TG****:: Posted my fractal grid.
3/18/2011 9:05:43 AM MT TG****:: MM,why wasn't the 3 minute hammer that openend at 10:06 or the one that opened at 10:30 a buy. Do you wait for some sort of display of further strength (or weakness in terms of a sell).
3/18/2011 9:04:40 AM MT Al****:: TG: you just gave me a piece of information I lacked. I've been trying to build an end of day data collector using yahoo, but I could not get the futures part right. Now I can go back to this project. Maybe I can finally replace my EOD data vendor.
3/18/2011 8:59:01 AM MT mm****:: I am going to wait for the next trade time - I don't like the wiggles on the chart
3/18/2011 8:54:26 AM MT TG****:: MM, I've been computing the pit levels myself in a spreadsheet. The yahoo finance web address I posted a few days ago with the SPM11.CME ticker has proven accurate for the daily range. Anyway I put the horizontal lines in place shortly after the close and it those levels seem to work very well in the overnight session as well.
3/18/2011 8:51:34 AM MT TG****:: For what it's worth, this little streak is on my up fractal grid that I started from the 8:24 low.
3/18/2011 7:41:34 AM MT mm****:: yes TG - isn't it amazing how the pit's S/R levels work even though the volume on the e mini is much larger than the one on the outcry S&P ?
3/18/2011 7:10:08 AM MT TG****:: punched all the way to R4 right into preoutcry tide time.
3/18/2011 5:23:23 AM MT mm****:: gm all - in the 40ies here - have a great day
9:00 Eastern-System: No comments


[ Live Clinics on Friday on DaytradingForecasts.com ]