![]()
![]()
********************************************************************************
Twitter Loses Its Tweet
Chaos Clinic for 1/24/2020
********************************************************************************
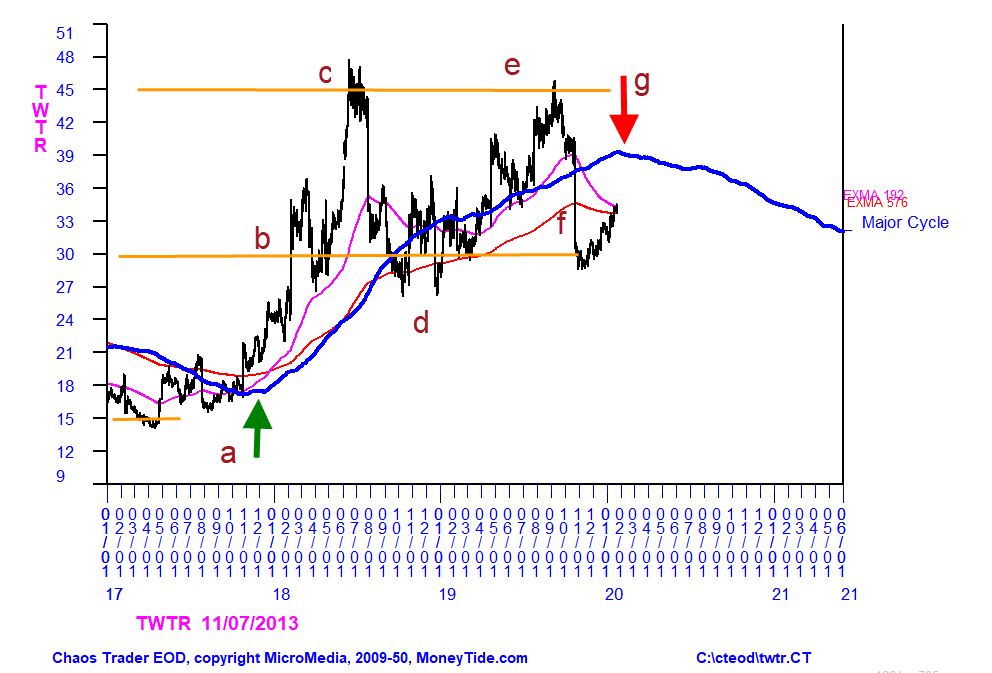
Back in April 2017, Twitter showed some signs that it might rally, after having
missed out on most of the decade long bull market. After making a small base at 15, it
jumped to 21, then back to 16. At that time, I used my WinXGO program to compute
an XGO forecast, then I filtered it with a 1752 day Zero Delay filter to bring out it's long
term Major Cycle, which is due to Jupiter. That forecast is the heavy blue line
on the chart above. Also shown on the chart are some letters, which are simply points
of interest on the chart, not any kind of wave count or lettering. Also shown on the chart
are two exponential moving averages of 192 and 576 days. These are the 3rd and 9th harmonics
of the Major cycle.
The Major cycle turned up at point a. The upturn was confirmed by upturns in both EXMAs, and
their crossing. At b, prices advanced a harmonic 15 points, then congested, but stayed above
the EXMAs. Thiss rally was fueled by profitability. By July 2018 prices jumped another 15
points to c. From there, they collapsed back halfwayto a congestion at d. The congestion is
marked by the convergencde of the EXMAs.
In April 2019 prices managed to get above the 192 day EXMA, and rally up into a double top at e.
Then in October, prices dropped vertically back to the nominal midpoint at 30.This particular drop
came when Twitter announced they would not carry 2020 political ads.
Finally, at g, the Major Cycle turns down. Prices have rallied up to the EXMAs in what looks like
a bounce in a down move. The bounce looks like a technical move off of the nominal 50% retrace.
Now that the Major cycle is turning down, I think Twitter has lost its tweet.
Personally, I managed to catch some of the 2017-2018 move from 21 to 36, but after that the volatility
was more than I liked. Of course, I was annoyed that I missed the move up to c, but was happy
that I also missed the move down to d. But I had no inclination to try to sell TWTR, knowing that
the Major Cycle was up, until now.
In this long bull market, TWTR was a laggard, being late to the party. Now it may the the canary
in the coal mine, warning of trouble ahead for the bull market.
For more on my work, see Moneytide.com
1/24/2020 1:59:56 PM MT Al****:: all charts are good on this end
1/24/2020 1:49:38 PM MT qq:: NY TICKS Tops and bottoms leading up strong since 2:30 EST. But with this much blood in the streets it's a big leap to go long.
1/24/2020 1:43:45 PM MT qq:: FWIW Hirsch's Stock Traders Almanac shows Bullish track record for this upcoming Monday.
1/24/2020 1:28:39 PM MT BOG****:: Dr Al, Good Afternoon. Please I cannot visualize the Moontide chart, Thanks. Have a Great Weekend.
1/24/2020 1:28:15 PM MT Al****:: we may have just switched from greed to fear
1/24/2020 1:27:25 PM MT Al****:: LOL: it was all in the Daniel chart
1/24/2020 1:15:24 PM MT qq:: First time heard on MSN that the Coronavirus fears have affected markets.
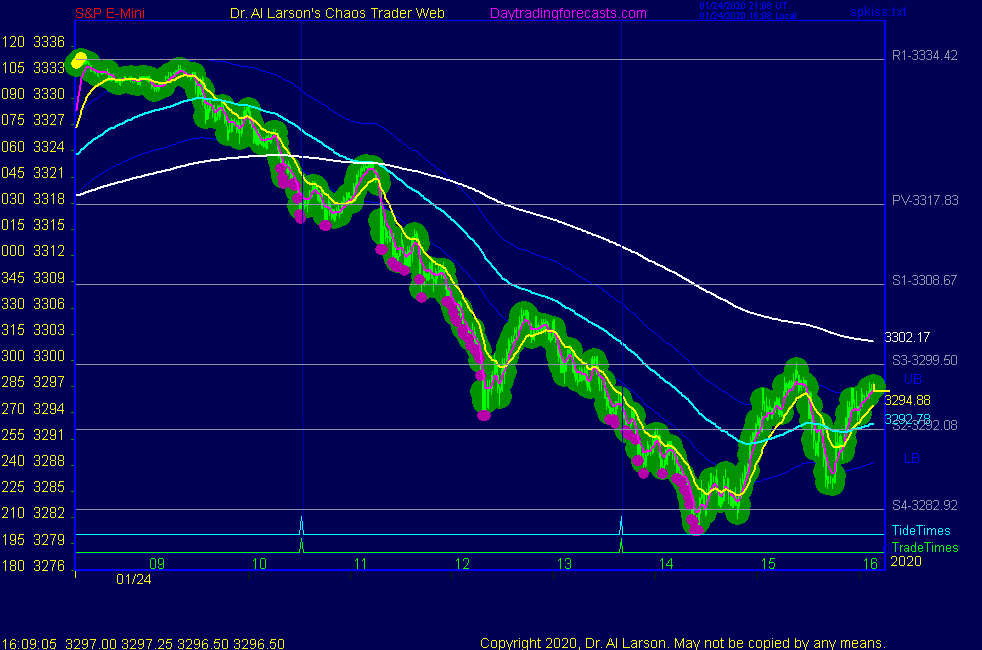
1/24/2020 1:15:22 PM MT Al****:: got a bounce at S4 - good time to exit for day traders-I'm done
Thanks for coming-see you next week -take some courses
Here are my actual trades today:
MES,SLD,1,3329.75,14:32:52,20200124
MES,SLD,1,3325.25,15:03:57,20200124
MES,SLD,1,3325.00,15:05:48,20200124
MES,BOT,3,3290.25,19:56:03,20200124
Net about $543
1/24/2020 12:26:57 PM MT :: F
1/24/2020 11:55:13 AM MT :: sorry 3295
1/24/2020 11:51:11 AM MT :: 3225stop
1/24/2020 11:41:18 AM MT Ted:: Thanks again for everything you've learned and shared, Al!
1/24/2020 11:37:07 AM MT :: sh
1/24/2020 11:36:24 AM MT Al****:: money keeps flowing into GLD and SLV
1/24/2020 11:34:20 AM MT Al****:: 5 month SH 8 Hr chart showing potential bottom - proceed at your own risk
1/24/2020 11:23:15 AM MT :: F
1/24/2020 10:53:40 AM MT Al****:: on Secret->Daniel chart yellow cycle turned down today, usually runs 1.5 to 3 days
and on Daniel chart today has magenta star burst near 3307
next lower one is 45 points lower
1/24/2020 10:48:02 AM MT AUT:: Currently the SP500 moved 9 bars on the H1 chart down, if this is the limit of the down move then the up move should not exceed 16 or 25 barsfrom the top made 9 bars back.
1/24/2020 10:48:01 AM MT :: sh
1/24/2020 10:42:00 AM MT AUT:: Thanks Al currently 3329.50 and 3318.83 could be levels to watch for weakness next week. Often the first retrace can be about 80% of the fall as everyone still thinks the market is going up.
1/24/2020 10:34:05 AM MT Al****:: AUT: it could be; next week will provide moire information.
Over the weekend Earth opposes Uranus helio, a 399 day cycle.
Today the rally from the 12/26/2018 low is 394 days
Major tops take time to be clear, and all the EXMAs have to turn down. The 6 day will be the first clue.
1/24/2020 10:21:50 AM MT AUT:: on the basis of the S P conjunction do you think this is the statrt of a greater move to the downside
1/24/2020 10:21:45 AM MT :: F
1/24/2020 10:21:27 AM MT Al****:: yesterday's low was from a Moon-Mercury cycle, highs this week were set by Moon's Node, and today is s New Moon
1/24/2020 10:15:34 AM MT Al****:: my astro work confirms the helio Saturn-Pluto conjunction has completed - see last week's Chaos Clinic on moeytide.com for more
1/24/2020 10:10:05 AM MT jvj****:: Thanks, AL
SNAFU here also
1/24/2020 10:02:37 AM MT Al****:: jvj-the chart is corect but the text is not - one of many minor bugs on new server
1/24/2020 9:51:58 AM MT jvj****:: Good Morning Everyone!
Al, when you get a chance, will you check the pivot point text data on the S&P 1 day chart? Does not appear to be updating.
1/24/2020 9:45:34 AM MT AUT:: SP500 is under the 50% level for this year at least a 2100 pip fall is going to happen as it resets itself.
1/24/2020 9:30:55 AM MT AUT:: The SAR virus will really go wild in Feb due to the cyclic peaks associated with cold and flu viruses these tend to occur in Feb, March and Sept and October. We also reached a solar maxima which last time coincide with the plague in 1600's
1/24/2020 9:26:57 AM MT AUT:: Martin Armstrong published a cycle point that he predicted would rock the markets on the 18th Jan 2020, this is not the top but I would expect a good fall from the high at least back to the daily 200 MA
1/24/2020 9:20:09 AM MT Pat:: What the fuck is going on with the markets?
1/24/2020 9:06:49 AM MT Al****:: or the Flash Boys sold R1 covered at pivot
1/24/2020 8:56:14 AM MT qq:: Fears of economic impact of Coronavirus on markets?
1/24/2020 8:31:34 AM MT Al****:: red swan plus vertical lines on Secret->esnat72
qq, your late comment yesterday was spot on
1/24/2020 7:54:34 AM MT RR:: GM All.
1/24/2020 7:30:43 AM MT srj****:: GM Al, all
1/24/2020 5:53:28 AM MT Al****:: GM all - good luck today
Chaos Clinic is posted on the AUX page
9:00 Eastern-System: No comments
![]()
![]()